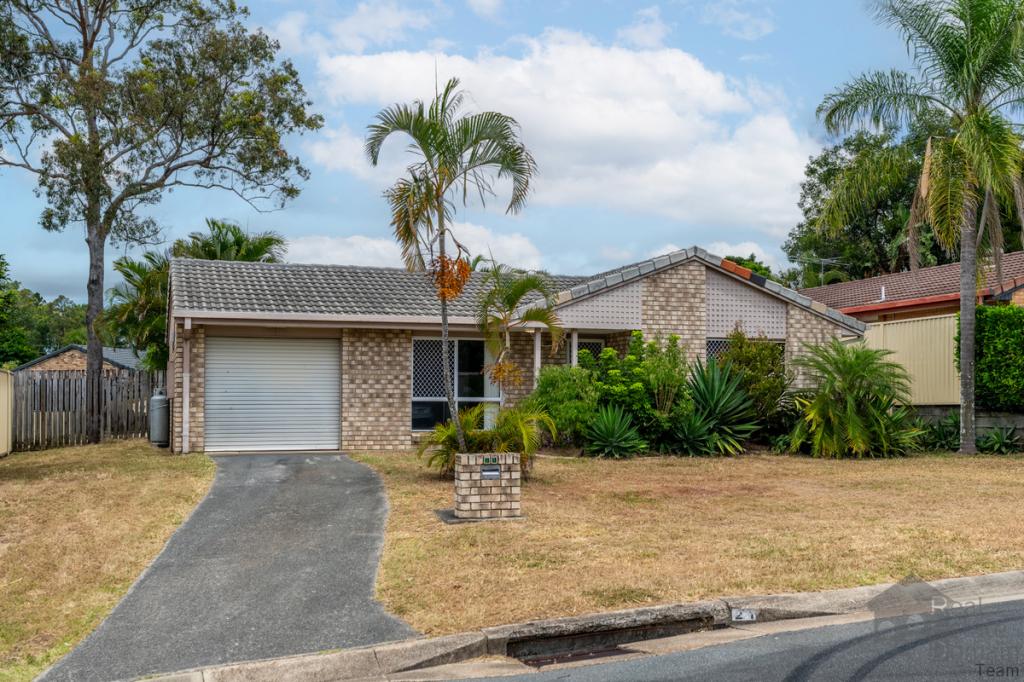
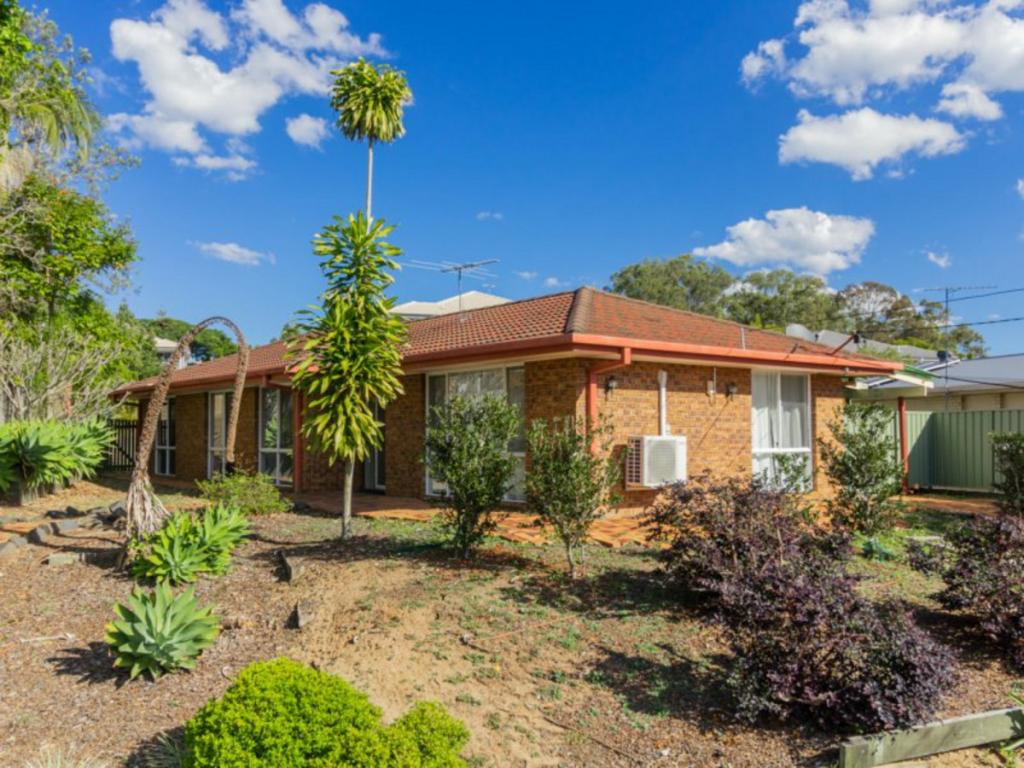
133 Short StreetBoronia Heights QLD 4124

Thinking about insurance?
Get estimated rebuild costs for this property with Sum SureProperty Details for 133 Short St, Boronia Heights
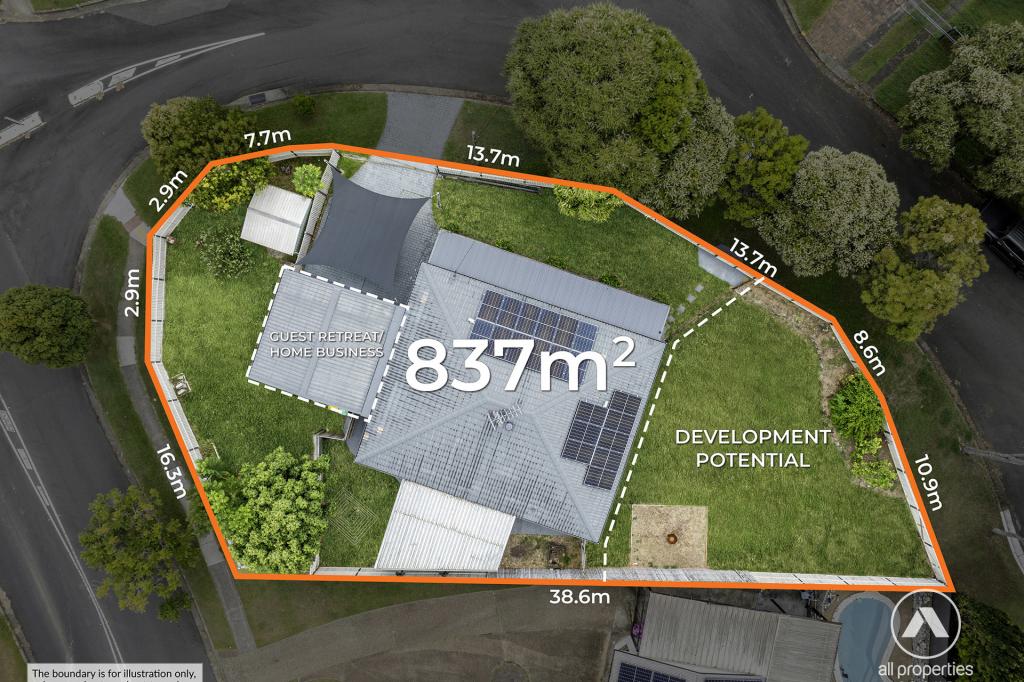
133 Short St, Boronia Heights is a 4 bedroom, 2 bathroom House with 3 parking spaces and was built in 1991. The property has a land size of 735m2 and floor size of 161m2. While the property is not currently for sale or for rent, it was last sold in December 2019.
Last Listing description (February 2020)
Absolutely stunning home with loads of character, you're going to love it. With an excellent floor plan, beautifully designed and tastefully renovated, it's just sensational!
You are safe and secure behind your front high gates and stunning front pathway leading into your doors. As soon as you step into your doorway you are greeted with an abundance of natural light due to the open plan design and seamless edges in the home. Your kitchen is fit for a 5 star chef with all the extra features and appliances.
Other first class features are:
Spacious master bedroom with ensuite and built in robe
3 further bedrooms
Zoned ducted air conditioning throughout even in the single lock up garage!
Single lock up garage is insulated and soundproofed, used for a music room
Stone feature walls upon entry and dining area
5KW solar panels
Covered outdoor entertaining area
Fully renovated and styled bathrooms
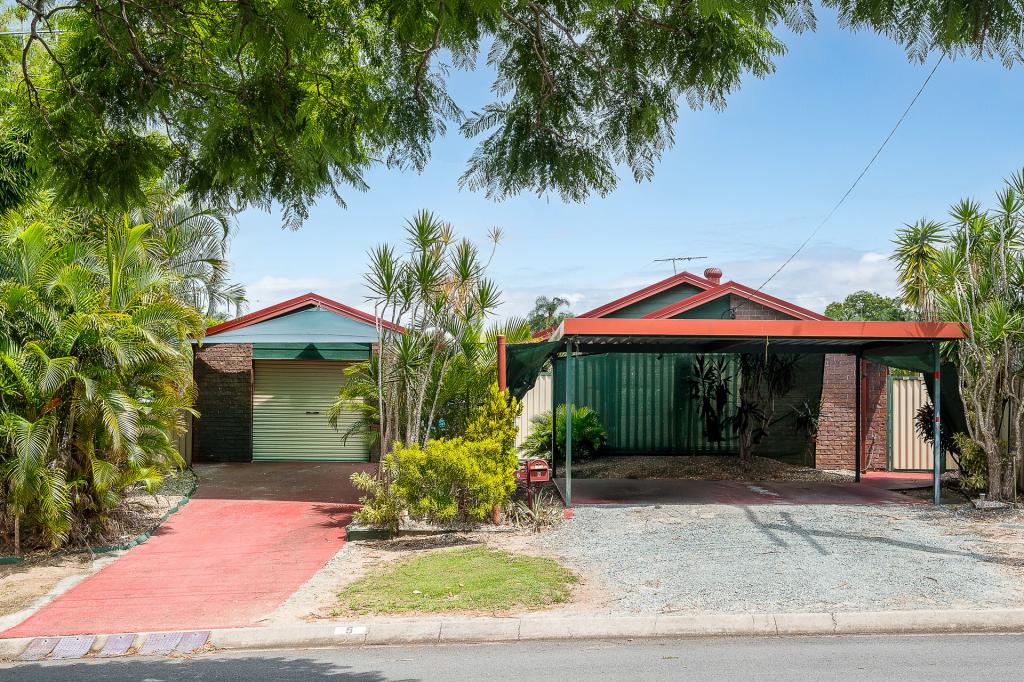
Double carport
Rendered exterior
2 Carport + Closed in single lock up garage (can be easily re-converted)
Level grassed yard and established gardens
Oozes class and style
Boronia Heights is a growing suburb full of families and surrounded by amenities, including schools, shops, parks, public transport and more. Close to Regents Park and Boronia Heights state schools, early learning centres, local shops, medical facilities and access to the Mount Lindsay Highway, this area is very central for families with school-aged children.
This is a must inspect! Contact Leisa Le on 0402 732 437 or Jessicca Gerretzen 0484 194 664 to inspect.
Property History for 133 Short St, Boronia Heights, QLD 4124
- 23 Dec 2019Sold for $460,000
- 20 Dec 2019Listed for Sale UNDER CONTRACT BY LEISA LE and JESSICCA
- 13 Jul 2013Listed for Rent $350 / week
Recent sales nearby
See more recent sales nearbySimilar properties For Sale nearby
See more properties for sale nearby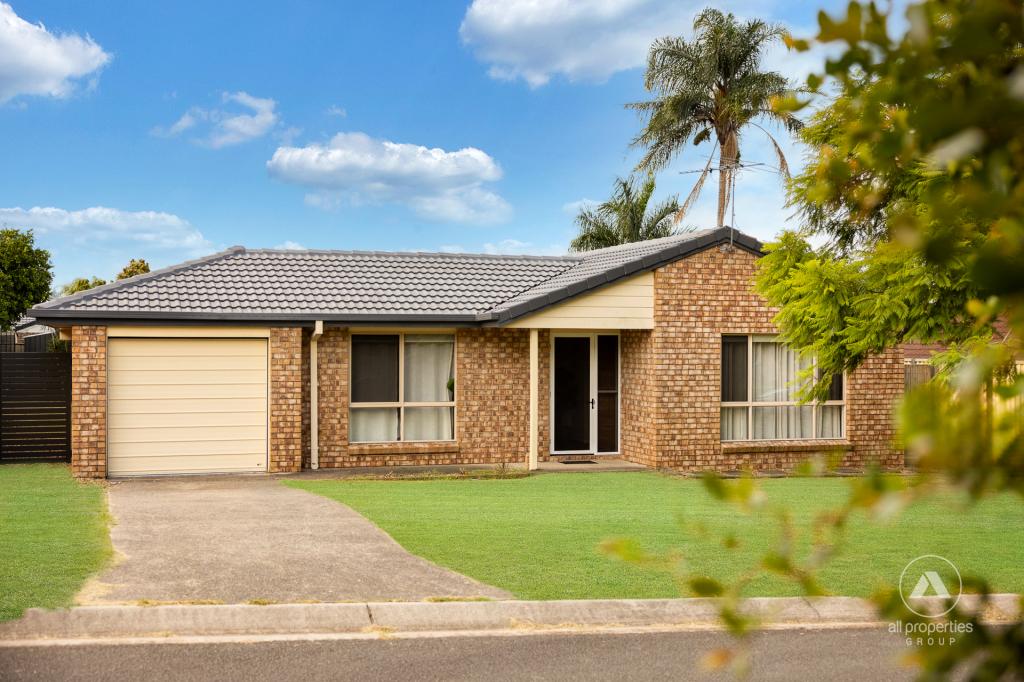

Similar properties For Rent nearby
See more properties for rent nearby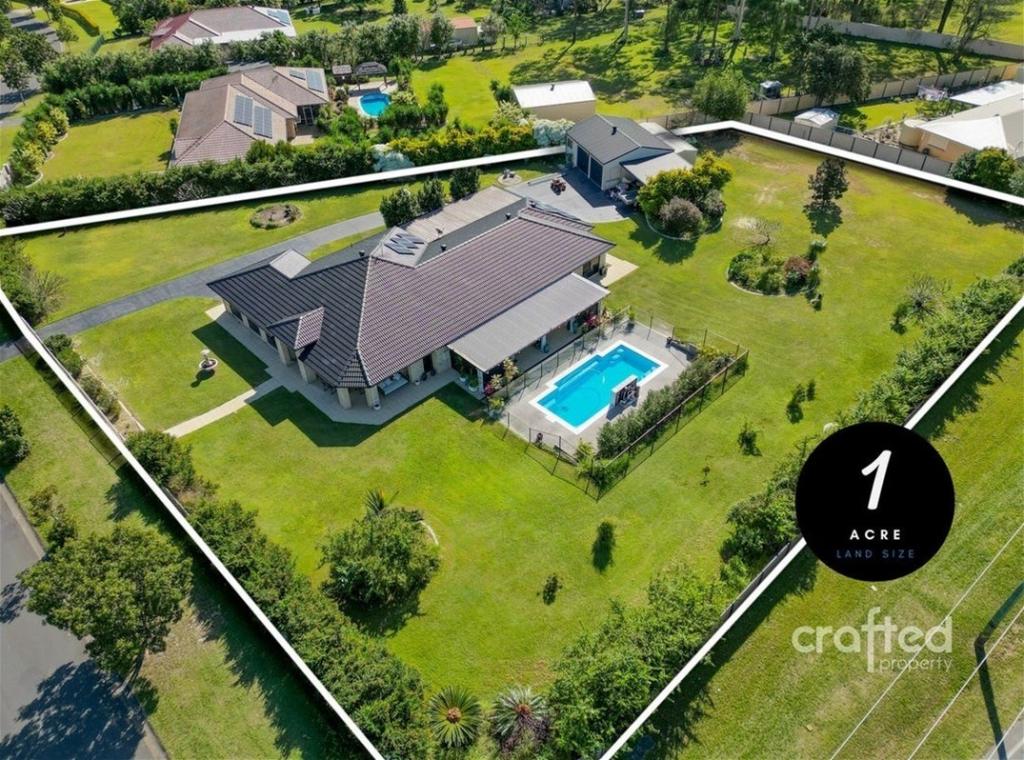
About Boronia Heights 4124
The size of Boronia Heights is approximately 4.3 square kilometres. It has 10 parks covering nearly 11.4% of total area. The population of Boronia Heights in 2011 was 7,604 people. By 2016 the population was 7,874 showing a population growth of 3.6% in the area during that time. The predominant age group in Boronia Heights is 0-9 years. Households in Boronia Heights are primarily couples with children and are likely to be repaying $1400 - $1799 per month on mortgage repayments. In general, people in Boronia Heights work in a trades occupation. In 2011, 59.9% of the homes in Boronia Heights were owner-occupied compared with 58.1% in 2016.
Boronia Heights has 2,964 properties. Over the last 5 years, Houses in Boronia Heights have seen a 111.26% increase in median value, while Units have seen a 118.23% increase. As at 28 February 2025:
- The median value for Houses in Boronia Heights is $749,662 while the median value for Units is $566,831.
- Houses have a median rent of $550 while Units have a median rent of $493.
What's around 133 Short St, Boronia Heights
133 Short St, Boronia Heights is in the school catchment zone for Boronia Heights State School and Park Ridge State High School.


Suburb Insights for Boronia Heights 4124
Market Insights
Boronia Heights Trends for Houses
$750k
14.51%
View Trend$550/W
4.13%
Boronia Heights Trends for Units
$567k
24.31%
View Trend$492.5/W
5.01%
Neighbourhood Insights
Age
Population 7,874
0-9
17%
10-19
14%
20-29
15%
30-39
15%
40-49
12%
50-59
11%
60-69
8%
70-79
4%
80-89
3%
90-99
1%
Household Structure
Occupancy
© Copyright 2025 RP Data Pty Ltd trading as CoreLogic Asia Pacific (CoreLogic). All rights reserved.
This product uses cookies and other similar technologies to improve and customise your browsing experience, to tailor content and adverts, and for analytics and metrics regarding visitor usage on this product and other media. We may share cookie and analytics information with third parties for the purposes of advertising. By continuing to use our website, you consent to cookies being used. View our Privacy Policy here.
X