2/2 Coral DriveBlacks Beach QLD 4740
Property Details for 2/2 Coral Dr, Blacks Beach
2/2 Coral Dr, Blacks Beach is a 2 bedroom, 1 bathroom Unit with 1 parking spaces and was built in 1980. The property has a land size of 80m2 and floor size of 69m2. While the property is not currently for sale or for rent, it was last sold in August 2009.
Last Listing description (August 2009)
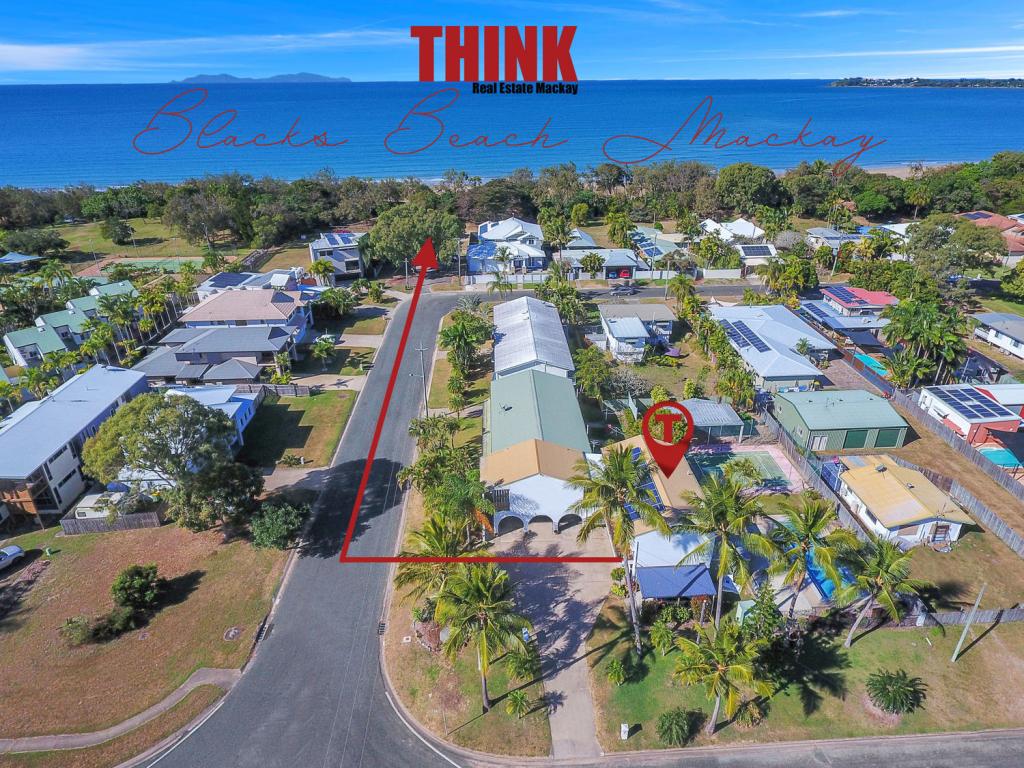
RELAXING RETREAT ALMOST BEACHFRONT BLACKS BEACH. GRANNY FRIENDLY.
This freshly renovated Villa at Blacks Beach La Salona has all the comforts of home and is a great investment as well, showing more than 95% occupancy.
2 Good size bedrooms, both air conditioned
Fully furnished on one level.
New lounge and dining furniture
Cool spacious balcony
Swimming pool - Maintained by onsite Manager
Walk to the beach, shops, and Tavern.
These are but a few of the many features this unit has to offer. Call Kathy today to inspect this fantastic unit.
Property History for 2/2 Coral Dr, Blacks Beach, QLD 4740
- 04 Aug 2009Sold for $238,000
- 23 Apr 2009Listed for Sale $245,000 ONO
- 31 Dec 2004Sold for $175,000
Commute Calculator
Recent sales nearby
See more recent sales nearby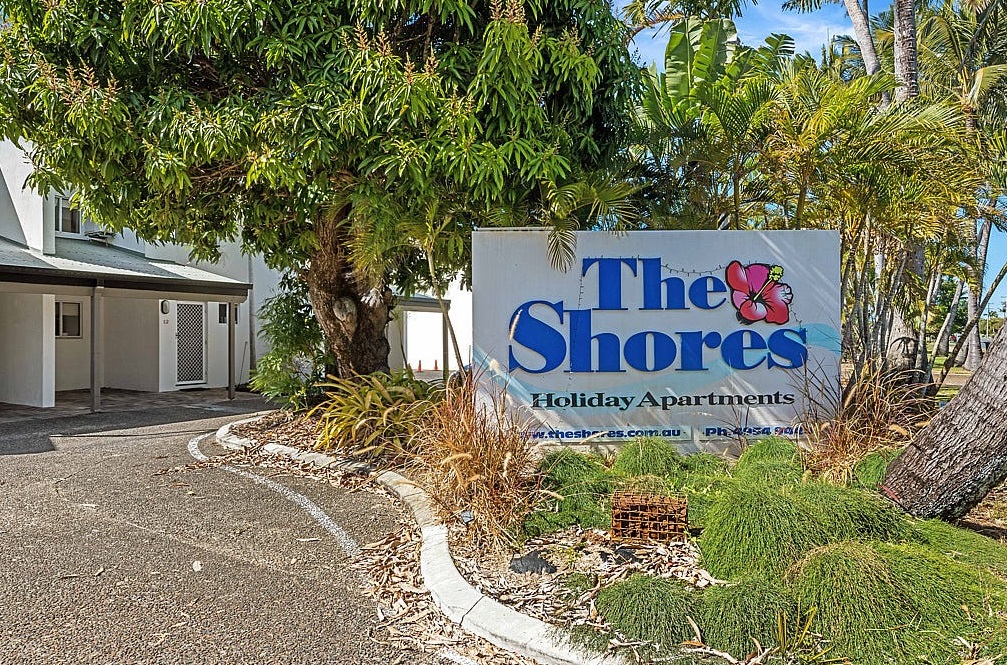 0
0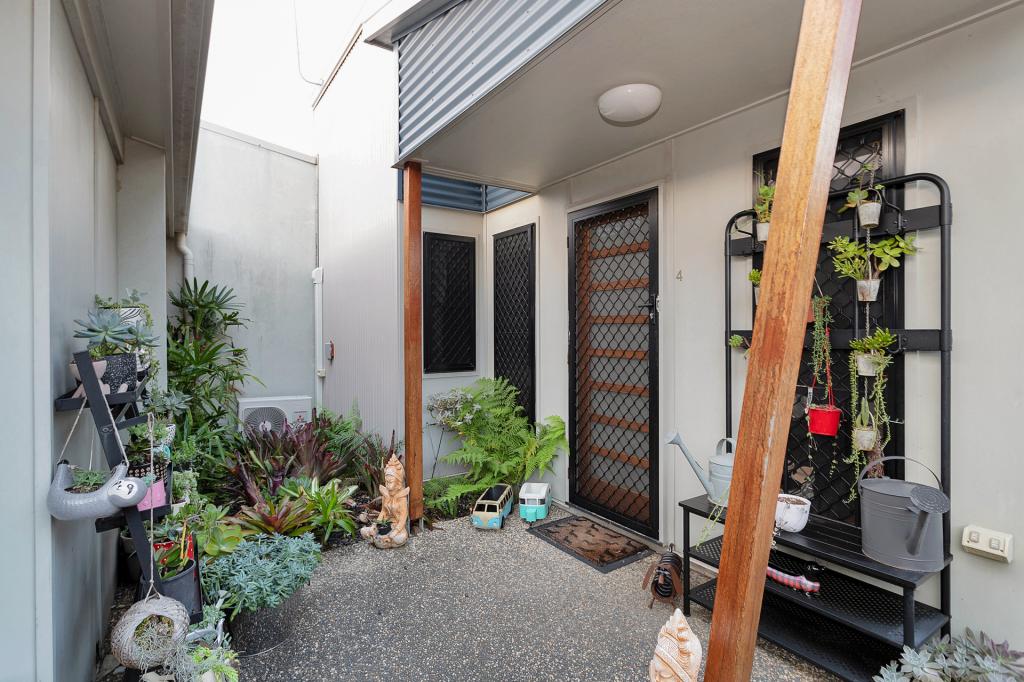 0
0Similar properties For Sale nearby
See more properties for sale nearby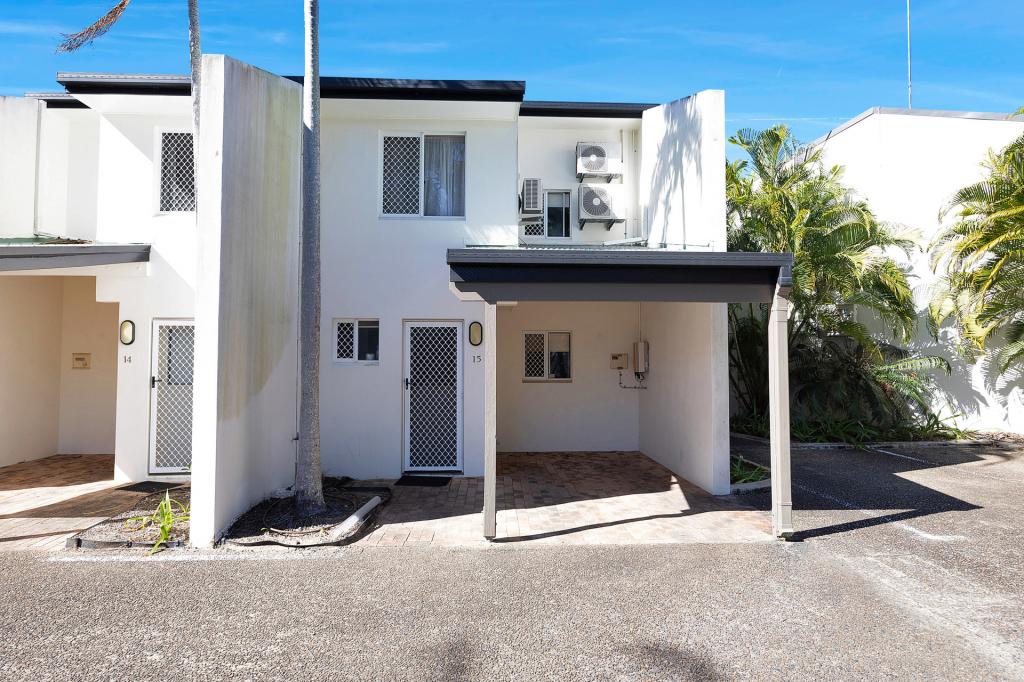 0
0
 0
0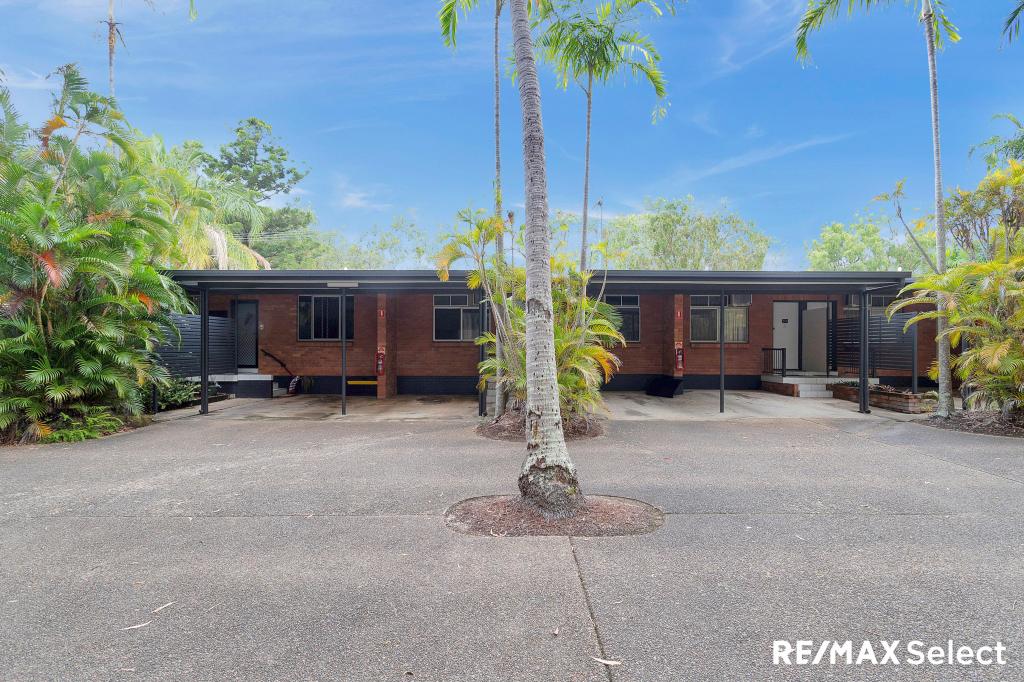 0
0Similar properties For Rent nearby
See more properties for rent nearby 0
0 0
0 0
0About Blacks Beach 4740
The size of Blacks Beach is approximately 6.5 square kilometres. It has 7 parks covering nearly 4.3% of total area. The population of Blacks Beach in 2011 was 2,871 people. By 2016 the population was 3,847 showing a population growth of 34.0% in the area during that time. The predominant age group in Blacks Beach is 0-9 years. Households in Blacks Beach are primarily couples with children and are likely to be repaying $1800 - $2399 per month on mortgage repayments. In general, people in Blacks Beach work in a trades occupation. In 2011, 53.2% of the homes in Blacks Beach were owner-occupied compared with 37.3% in 2016.
Blacks Beach has 1,880 properties. Over the last 5 years, Houses in Blacks Beach have seen a 46.01% increase in median value, while Units have seen a 55.18% increase. As at 31 July 2024:
- The median value for Houses in Blacks Beach is $547,619 while the median value for Units is $371,516.
- Houses have a median rent of $570 while Units have a median rent of $470.
Suburb Insights for Blacks Beach 4740
Market Insights
Blacks Beach Trends for Houses
N/A
N/A
View TrendN/A
N/A
Blacks Beach Trends for Units
N/A
N/A
View TrendN/A
N/A
Neighbourhood Insights
© Copyright 2024 RP Data Pty Ltd trading as CoreLogic Asia Pacific (CoreLogic). All rights reserved.
This product uses cookies and other similar technologies to improve and customise your browsing experience, to tailor content and adverts, and for analytics and metrics regarding visitor usage on this product and other media. We may share cookie and analytics information with third parties for the purposes of advertising. By continuing to use our website, you consent to cookies being used. View our Privacy Policy here.
X