3/27 Mannikan CourtBakewell NT 0832
Property Details for 3/27 Mannikan Ct, Bakewell
3/27 Mannikan Ct, Bakewell is a 2 bedroom, 1 bathroom House with 2 parking spaces and was built in 1998. The property has a land size of 122m2 and floor size of 83m2. While the property is not currently for sale or for rent, it was last sold in March 2025. There are 3 other 2 bedroom Houses sold in Bakewell in the last 12 months.
Last Listing description (August 2021)
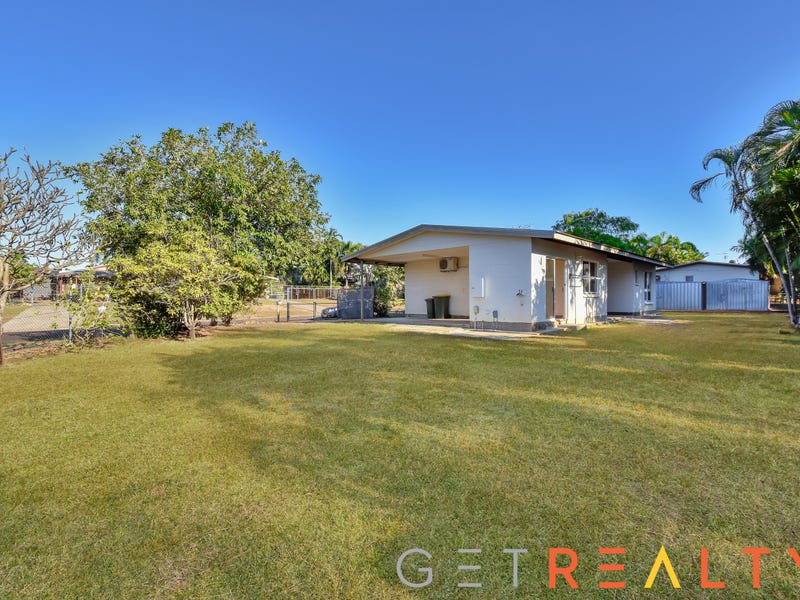
Approved Real Estate is excited to present you this ground level unit in a quite complex. Located in Mannikan Court Bakewell, within walking distance to the Bakewell shops.
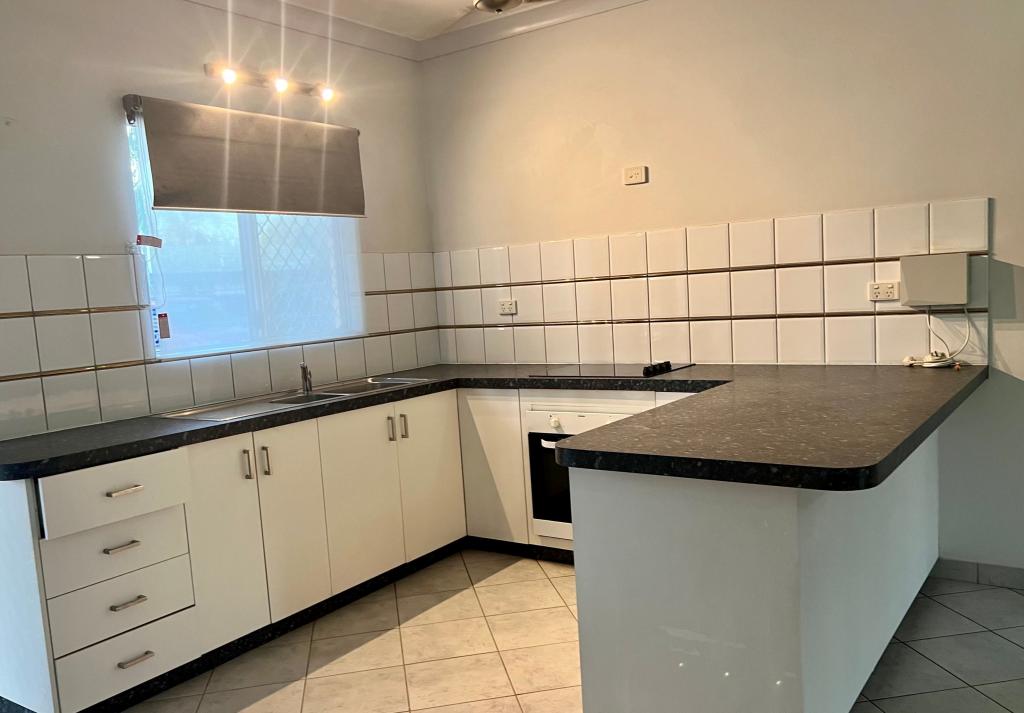
This lovely unit has the following features:
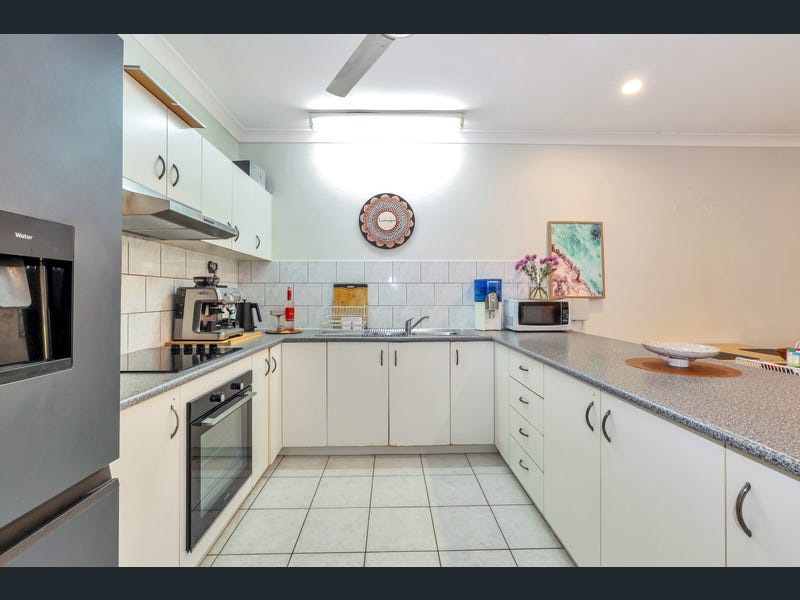
* Easy to work in kitchen with plenty of cupboard space.
* 2 comfortable bedrooms
* Indoor laundry and separate toilet.
* 2 Covered car parks.
* No pets at the complex.
Call our office on 8931 2500 or register your next appointment to view with Antonia.
Property History for 3/27 Mannikan Ct, Bakewell, NT 0832
- 11 Mar 2025Sold for $320,000
- 11 Mar 2025Sold for $220,000
- 15 Jul 2021Listed for Rent $410 / week
Recent sales nearby
See more recent sales nearbySimilar properties For Sale nearby
See more properties for sale nearby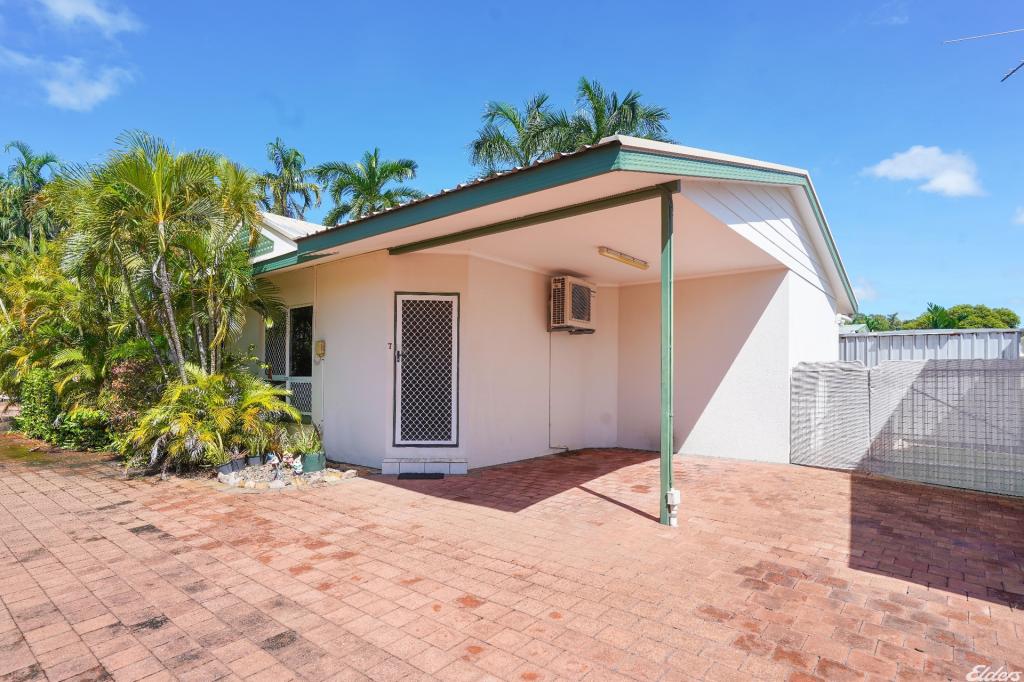
Similar properties For Rent nearby
See more properties for rent nearby
About Bakewell 0832
The size of Bakewell is approximately 1.4 square kilometres. It has 9 parks covering nearly 5.1% of total area. The population of Bakewell in 2011 was 3,191 people. By 2016 the population was 3,075 showing a population decline of 3.6% in the area during that time. The predominant age group in Bakewell is 30-39 years. Households in Bakewell are primarily couples with children and are likely to be repaying $1800 - $2399 per month on mortgage repayments. In general, people in Bakewell work in a clerical occupation. In 2011, 56.9% of the homes in Bakewell were owner-occupied compared with 55% in 2016.
Bakewell has 1,438 properties. Over the last 5 years, Houses in Bakewell have seen a 26.61% increase in median value, while Units have seen a 34.19% increase. As at 28 February 2025:
- The median value for Houses in Bakewell is $494,727 while the median value for Units is $280,618.
- Houses have a median rent of $530 while Units have a median rent of $480.
What's around 3/27 Mannikan Ct, Bakewell


Suburb Insights for Bakewell 0832
Market Insights
Bakewell Trends for Houses
$495k
1.59%
View Trend$530/W
6.64%
Bakewell Trends for Units
$281k
-1.55%
View Trend$480/W
9.03%
Neighbourhood Insights
Age
Population 3,075
0-9
18%
10-19
11%
20-29
19%
30-39
19%
40-49
15%
50-59
10%
60-69
6%
70-79
1%
80-89
1%
Household Structure
Occupancy
© Copyright 2025 RP Data Pty Ltd trading as CoreLogic Asia Pacific (CoreLogic). All rights reserved.
This product uses cookies and other similar technologies to improve and customise your browsing experience, to tailor content and adverts, and for analytics and metrics regarding visitor usage on this product and other media. We may share cookie and analytics information with third parties for the purposes of advertising. By continuing to use our website, you consent to cookies being used. View our Privacy Policy here.
X