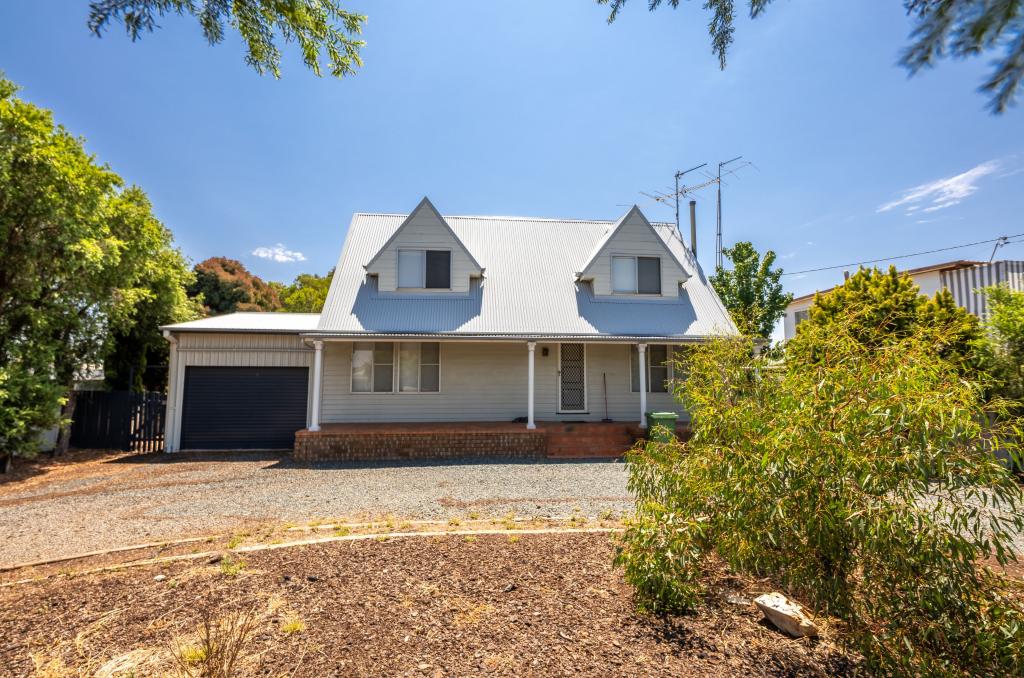
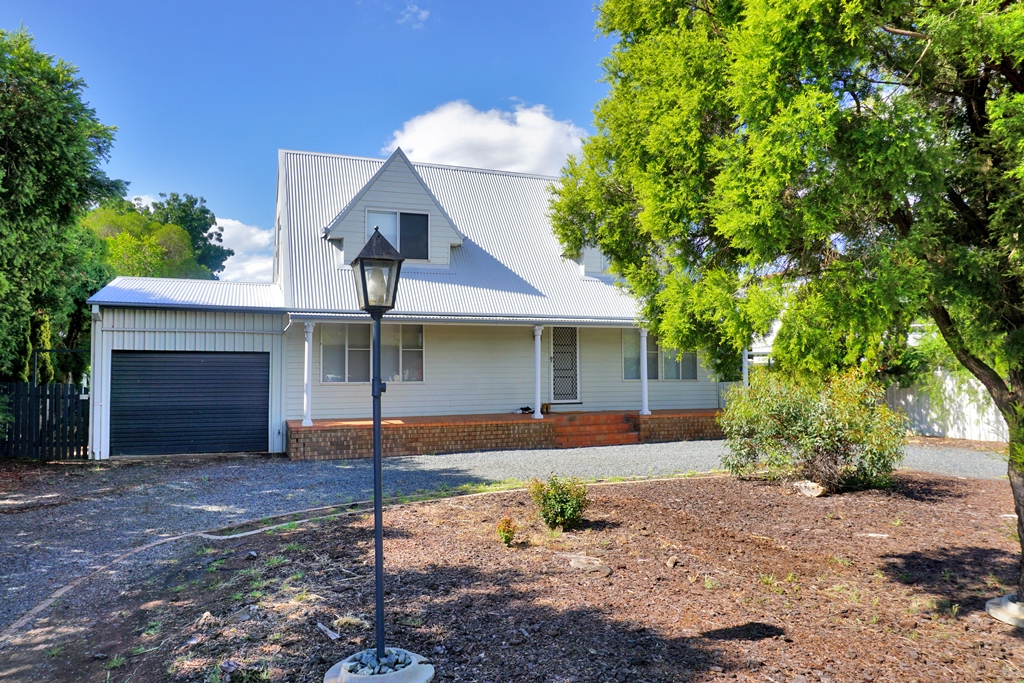
94 Neeld StreetWyalong NSW 2671

Thinking about insurance?
Get estimated rebuild costs for this property with Sum SureProperty Details for 94 Neeld St, Wyalong
94 Neeld St, Wyalong is a 5 bedroom, 2 bathroom House and was built in 1950. The property has a land size of 2024m2 and floor size of 227m2. While the property is not currently for sale or for rent, it was last sold in August 2015.
Last Listing description (February 2016)
Home features 3 bedrooms, all with built in robes.
Modern style open kitchen, overlooks main lounge area.
2 good size living areas.
Great size house block, fully fenced.
Additional vacant block next to house block.
Rear lane access to both blocks.
Total land size 2024m2.
This home is currently under offer.
Property History for 94 Neeld St, Wyalong, NSW 2671
- 31 Oct 2023Sold
- 12 Aug 2015Sold for $95,000
- 03 Aug 2015Listed for Sale $89,000
Recent sales nearby
See more recent sales nearbySimilar properties For Sale nearby
See more properties for sale nearby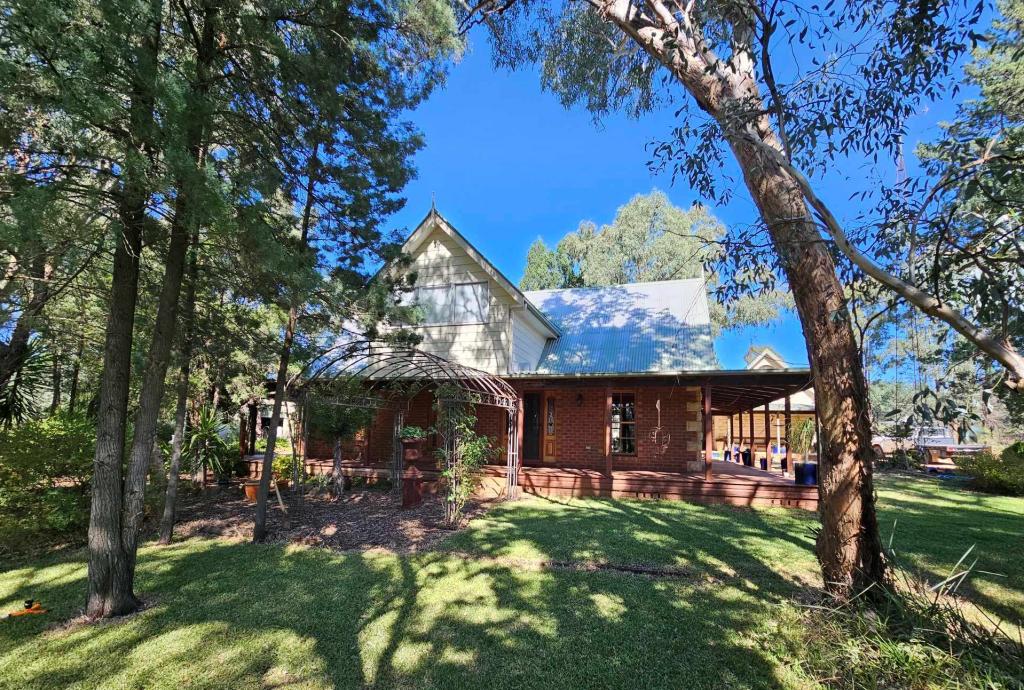
About Wyalong 2671
The size of Wyalong is approximately 354.9 square kilometres. It has 7 parks covering nearly 1% of total area. The population of Wyalong in 2011 was 851 people. By 2016 the population was 659 showing a population decline of 22.6% in the area during that time. The predominant age group in Wyalong is 50-59 years. Households in Wyalong are primarily childless couples and are likely to be repaying $1000 - $1399 per month on mortgage repayments. In general, people in Wyalong work in a trades occupation. In 2011, 73.2% of the homes in Wyalong were owner-occupied compared with 73.2% in 2016.
Wyalong has 523 properties. Over the last 5 years, Houses in Wyalong have seen a 37.70% increase in median value, while Units have seen a 35.73% increase. As at 28 February 2025:
- The median value for Houses in Wyalong is $285,190 while the median value for Units is $477,638.
What's around 94 Neeld St, Wyalong
94 Neeld St, Wyalong is in the school catchment zone for Wyalong Public School and West Wyalong High School.


Suburb Insights for Wyalong 2671
Market Insights
Wyalong Trends for Houses
$285k
1.23%
View TrendN/A
N/A
Wyalong Trends for Units
$478k
N/A
View TrendN/A
5.24%
Neighbourhood Insights
Age
Population 659
0-9
13%
10-19
10%
20-29
11%
30-39
12%
40-49
14%
50-59
17%
60-69
15%
70-79
7%
80-89
4%
Household Structure
Occupancy
© Copyright 2025 RP Data Pty Ltd trading as CoreLogic Asia Pacific (CoreLogic). All rights reserved.
This product uses cookies and other similar technologies to improve and customise your browsing experience, to tailor content and adverts, and for analytics and metrics regarding visitor usage on this product and other media. We may share cookie and analytics information with third parties for the purposes of advertising. By continuing to use our website, you consent to cookies being used. View our Privacy Policy here.
X