181 Shady Lane, Wallagoot, NSW 2550 | Property Value & History | OnTheHouse
OFF MARKET
Are you the owner?

181 Shady Lane
Wallagoot NSW 2550

Bedrooms: 3
Bathrooms: 1
Car spaces: 4
Land area: 2613m2
Estimated Value & Rent
Estimated Value
Estimated Rent
Low Confidence
Last updated 7 Apr 2025
Low

High
$750k
$800k
Save

Property Details for 181 Shady Lane, Wallagoot

181 Shady Lane, Wallagoot is a 3 bedroom, 1 bathroom House with 4 parking spaces. The property has a land size of 2613m2. While the property is not currently for sale or for rent, it was last sold in May 2006.

Building Type
House
Land Size
2613m2
Local Government
Bega Valley
Lot/Plan
3/DP285667

Last Listing description (March 2023)

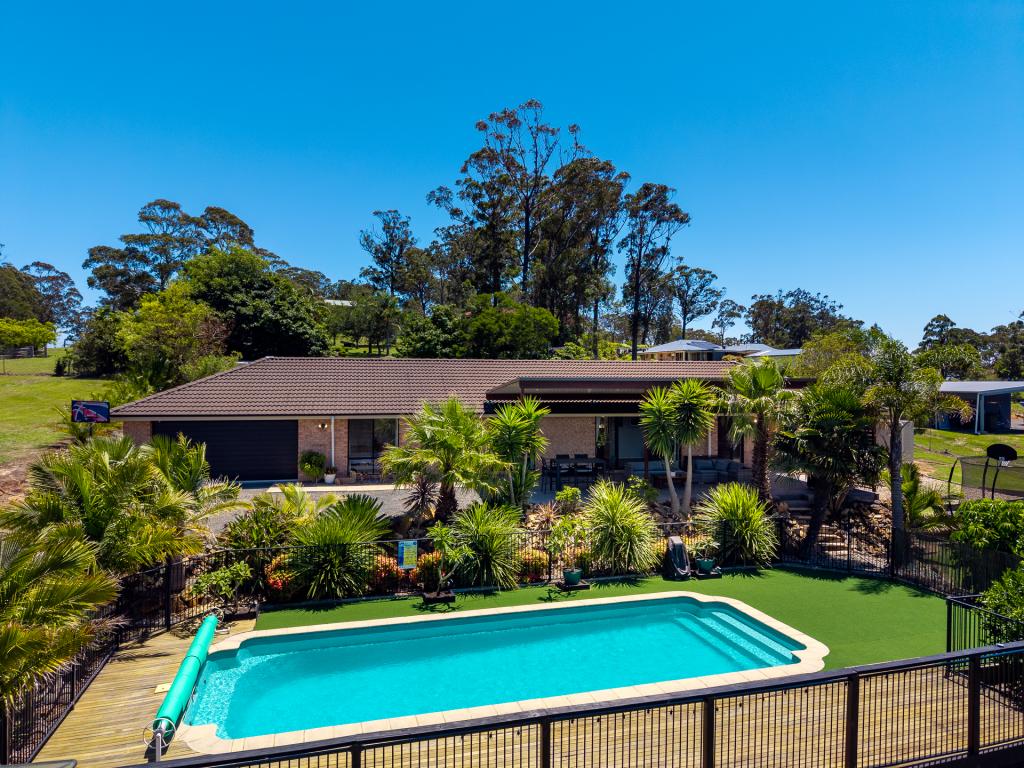
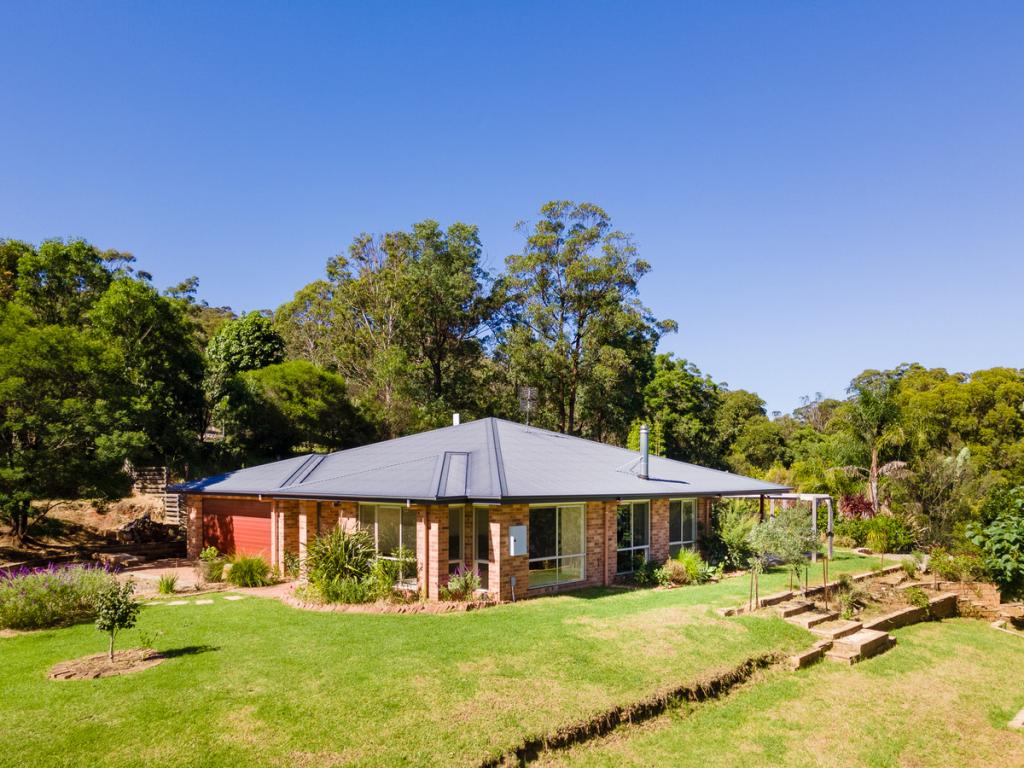
This modern, light filled, 3 bedroom 1 bathroom home, has a fresh & tasteful feel to it. Offering the ideal open plan living, dining & kitchen space. Generous size deck providing the ideal seamless flow of indoors to outdoors. The bedroom all have built in wardrobes. With plenty of space this home also offers you a 6 stable horse shed which can be used for storage or a large man cave!

$540 PER WEEK
PETS CONSIDERED.

12 MONTH LEASE.

Property History for 181 Shady Lane, Wallagoot, NSW 2550

A timeline of how this property has performed in the market
Last Sold
$60,000
11 May 2006
Listed for Rent
$540/w
13 Mar 2023
  • 13 Mar 2023
    Listed for Sale $540
  • 13 Mar 2023
    Listed for Rent $540 / week
  • 24 Aug 2022
    Listed for Rent $540 / week
Sign in to see more transactions

Commute Calculator

Where to?
-
-
-
-

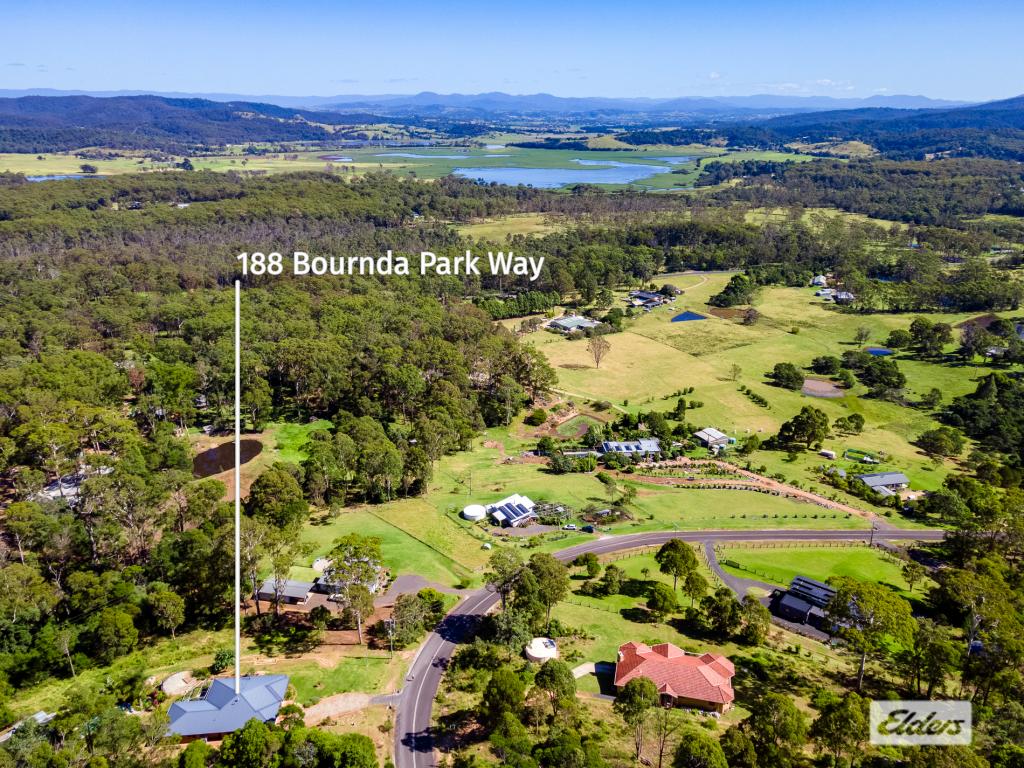
About Wallagoot 2550

The size of Wallagoot is approximately 37.6 square kilometres. It has 2 parks covering nearly 9.5% of total area. The population of Wallagoot in 2011 was 470 people. By 2016 the population was 502 showing a population growth of 6.8% in the area during that time. The predominant age group in Wallagoot is 50-59 years. Households in Wallagoot are primarily childless couples and are likely to be repaying $1000 - $1399 per month on mortgage repayments. In general, people in Wallagoot work in a professional occupation. In 2011, 85.1% of the homes in Wallagoot were owner-occupied compared with 89.6% in 2016.

Wallagoot has 314 properties. Over the last 5 years, Houses in Wallagoot have seen a 49.64% increase in median value, while Units have seen a 59.55% increase. As at 31 March 2025:

  • The median value for Houses in Wallagoot is $956,507 while the median value for Units is $399,016.
There are currently 5 properties listed for sale, and no properties listed for rent in Wallagoot on OnTheHouse. According to CoreLogic's data, 10 properties were sold in the past 12 months in Wallagoot.

What's around 181 Shady Lane, Wallagoot

181 Shady Lane, Wallagoot is in the school catchment zone for Tathra Public School and Bega High School.

Nearby Schools
Comparable Properties
Bournda Environmental Education Centre
3.55km
Bournda National Park Kalaru NSW 2550 Kalaru 2550
SpecialCombined Enrolled
Tathra Public School
6.17km
Tathra 2550
IN CATCHMENTPrimaryGovernmentP - 6Combined213 Enrolled
Sapphire Coast Anglican College
9.47km
Bega 2550
CombinedNon-GovernmentP - 12Combined288 Enrolled
Thomas More Christian Montessori School
10.49km
Bega 2550
PrimaryNon-GovernmentP - 6Combined24 Enrolled
Bega High School
11.6km
Bega 2550
IN CATCHMENTSecondaryGovernment7 - 12Combined749 Enrolled
Mumbulla School for Rudolf Steiner Education
11.65km
Bega 2550
PrimaryNon-GovernmentP - 6Combined172 Enrolled
Bega Valley Public School
12.15km
Bega 2550
PrimaryGovernmentP - 6Combined336 Enrolled
Wolumla Public School
12.63km
Wolumla 2550
PrimaryGovernmentP - 6Combined66 Enrolled
Tanja Public School
14.19km
Tanja 2550
PrimaryGovernmentP - 6Combined17 Enrolled
Merimbula Public School
14.2km
Merimbula 2548
PrimaryGovernmentP - 6Combined404 Enrolled

Suburb Insights for Wallagoot 2550

Market Insights
Wallagoot Trends for Houses
Median Value

N/A

-
View Trend
Median Growth

N/A

View Trend
Median Rent

N/A

-
View Trend
Rental Yield

N/A

-
View Trend
Median Value: The middle value of all properties across the geography based on the Automated Valuation Model.


Median Value over 1 year
Wallagoot Trends for Units
Median Value

N/A

-
View Trend
Median Growth

N/A

View Trend
Median Rent

N/A

-
View Trend
Rental Yield

N/A

-
View Trend
Median Value: The middle value of all properties across the geography based on the Automated Valuation Model.


Median Value over 1 year
Neighbourhood Insights
Age

Population 502

0-9


13%

10-19


10%

20-29


3%

30-39


11%

40-49


13%

50-59


21%

60-69


16%

70-79


7%

80-89


2%

Household Structure
Occupancy
Disclaimer
Whilst all reasonable effort is made to ensure the information in this publication is current, CoreLogic does not warrant the accuracy or completeness of the data and information contained in this publication and to the full extent not prohibited by law excludes all liability for any loss or damage arising in connection with the data and information contained in this publication.
New South Wales data
Contains property sales information provided under licence from the Valuer General New South Wales. RP Data Pty Ltd trading as CoreLogic Asia Pacific is authorised as a Property Sales Information provider by the Valuer General New South Wales.
Valuations and Estimates
This estimate is provided by CoreLogic, and is based on statistical market data such as recent local sales, property size, number of bedrooms and many more factors. It comes from public data, which may be incomplete or inaccurate, and should not be used in lieu of a professional appraisal under any circumstances, including for lending purposes or in home loan applications.
School data and Content
Product Data licenced by CoreLogic under a Creative Commons Attribution licence. For details regarding licence, data source, copyright and disclaimers, see https://www.corelogic.com.au/legals/third-party-restrictions
ABS data
This publication contains data and statistics provided by the Australian Bureau of Statistics, available at http://www.abs.gov.au/ and reproduced under Creative Commons Attribution 2.5 http://creativecommons.org/licenses/by/2.5/au/legalcode
Liveability information
The Liveability Score is a rating (out of 10) provided by Propella.ai Pty Ltd as a guide about how "well-connected" properties are in certain local areas. The Liveability Score is based on statistical data about a local area in which a property is located including the distance to and number of available facilities and services (including schools, parklands, health services, shopping and public transport) (Liveability Data). The Liveability Data and Liveability Score has not been verified or confirmed by CoreLogic, is not available for all properties, and is of a general nature and should not be construed as specific advice or relied upon in lieu of appropriate professional advice. Given the relative nature of the Liveability Score, propella.ai anticipate that scores for individual properties will change over time.