259 Lower Bobo RoadUlong NSW 2450
Property Details for 259 Lower Bobo Rd, Ulong
259 Lower Bobo Rd, Ulong is a 4 bedroom, 1 bathroom House and was built in 1990. The property has a land size of 20000m2 and floor size of 110m2. While the property is not currently for sale or for rent, it was last sold in July 2019.
Last Listing description (July 2019)
This picturesque rural property situated on the Lower Bobo Road at Ulong, offers a perfect environment for running a couple of horses or the hobby farmer looking for secluded idyllic rural setting.
The property is fully fenced and the land gently undulating and picturesque, with a creek in the front of the property.
The home features a spacious kitchen and a nicely renovated bathroom. There are four bedrooms and a large open plan living/dining, complete with wood fire as well as air conditioning for cooling in the summer months.
Leave the crowds and a stressful existence behind and enjoy spending time with your family living life the way it should be.
Call Cheryl Donaldson to inspect today on 0412 675 240.
Property History for 259 Lower Bobo Rd, Ulong, NSW 2450
- 09 Jul 2019Sold for $315,000
- 04 Jul 2019Listed for Sale Not Disclosed
- 11 Nov 2005Sold for $150,000
Commute Calculator
Recent sales nearby
See more recent sales nearby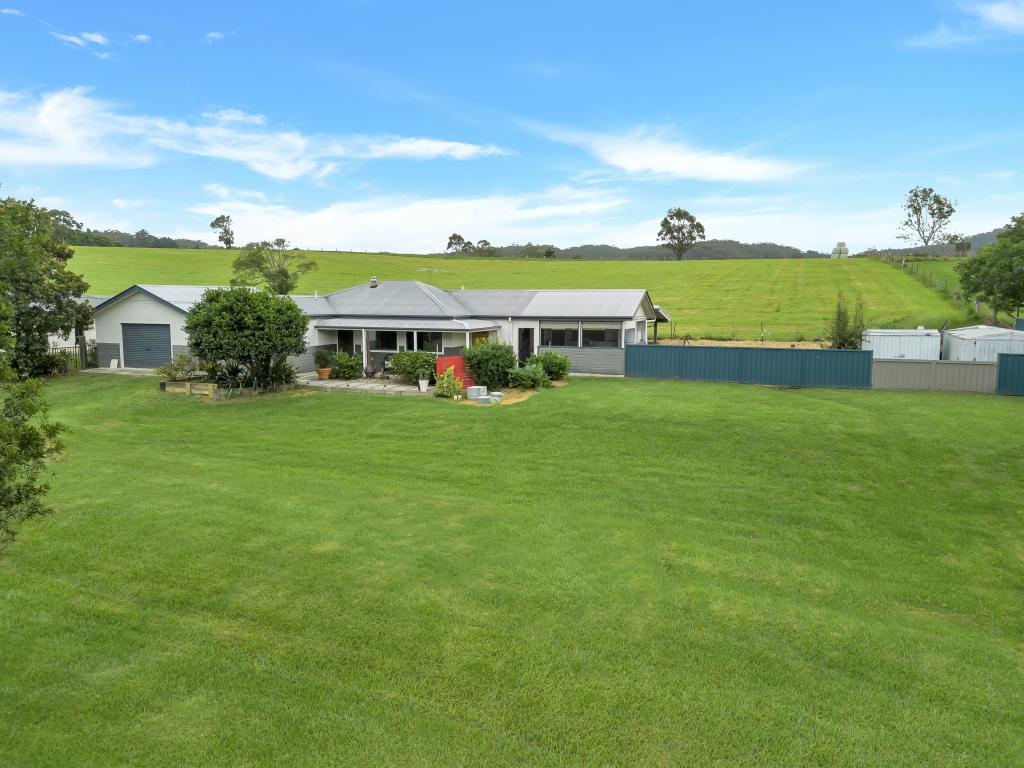 0
0
 0
0 0
0About Ulong 2450
The size of Ulong is approximately 34.7 square kilometres. It has 5 parks covering nearly 30.2% of total area. The population of Ulong in 2011 was 264 people. By 2016 the population was 246 showing a population decline of 6.8% in the area during that time. The predominant age group in Ulong is 50-59 years. Households in Ulong are primarily couples with children and are likely to be repaying $300 - $449 per month on mortgage repayments. In general, people in Ulong work in a labourer occupation. In 2011, 76.6% of the homes in Ulong were owner-occupied compared with 63.1% in 2016.
Ulong has 142 properties. Over the last 5 years, Houses in Ulong have seen a 45.03% increase in median value. As at 31 October 2024:
- The median value for Houses in Ulong is $483,221 while the median value for Units is $289,926.
Suburb Insights for Ulong 2450
Market Insights
Ulong Trends for Houses
N/A
N/A
View TrendN/A
N/A
Ulong Trends for Units
N/A
N/A
View TrendN/A
N/A
Neighbourhood Insights
© Copyright 2024 RP Data Pty Ltd trading as CoreLogic Asia Pacific (CoreLogic). All rights reserved.
This product uses cookies and other similar technologies to improve and customise your browsing experience, to tailor content and adverts, and for analytics and metrics regarding visitor usage on this product and other media. We may share cookie and analytics information with third parties for the purposes of advertising. By continuing to use our website, you consent to cookies being used. View our Privacy Policy here.
X