109 Murray StreetTumbarumba NSW 2653
Property Details for 109 Murray St, Tumbarumba
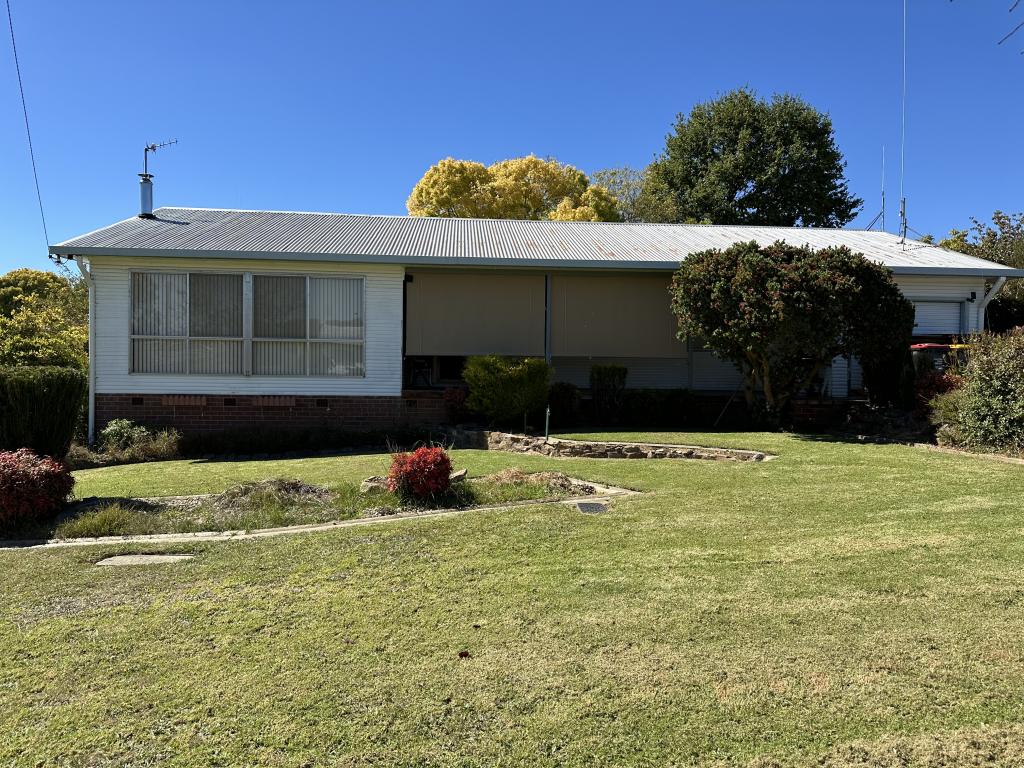
109 Murray St, Tumbarumba is a 4 bedroom, 2 bathroom House with 2 parking spaces. The property has a land size of 1073m2 and floor size of 182m2. While the property is not currently for sale or for rent, it was last sold in September 2016.
Last Listing description (March 2022)
You wont need a car when you live this close to town!
Neat & tidy two bedroom unit located on the top floor
Built in wardrobes in both bedrooms,
Shared garage
Close to the primary school and walking distance to the main street
Lawn and garden maintenance included!
Available approximately 8th March 2022
Sorry, pets not permitted
Inspections strictly by appointment
Applications must be completed prior to inspecting
Property History for 109 Murray St, Tumbarumba, NSW 2653
- 24 Feb 2022Listed for Rent - Price not available
- 11 May 2021Listed for Rent $220 / week
- 03 Jan 2019Listed for Rent - Price not available
Commute Calculator
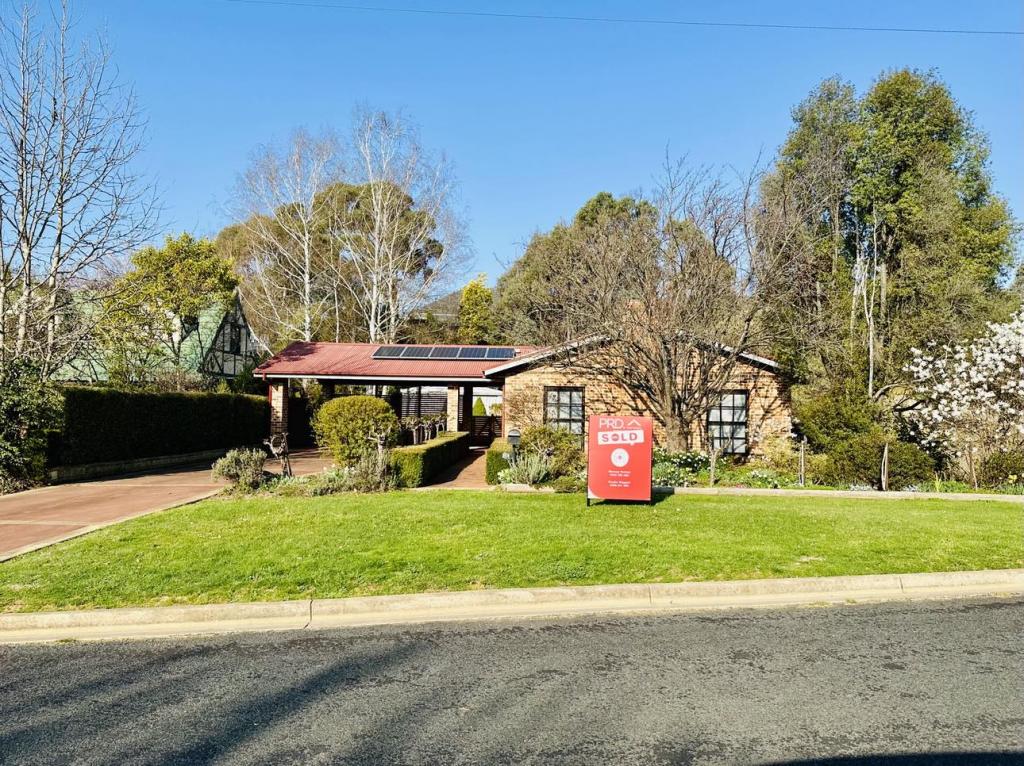
Recent sales nearby
See more recent sales nearby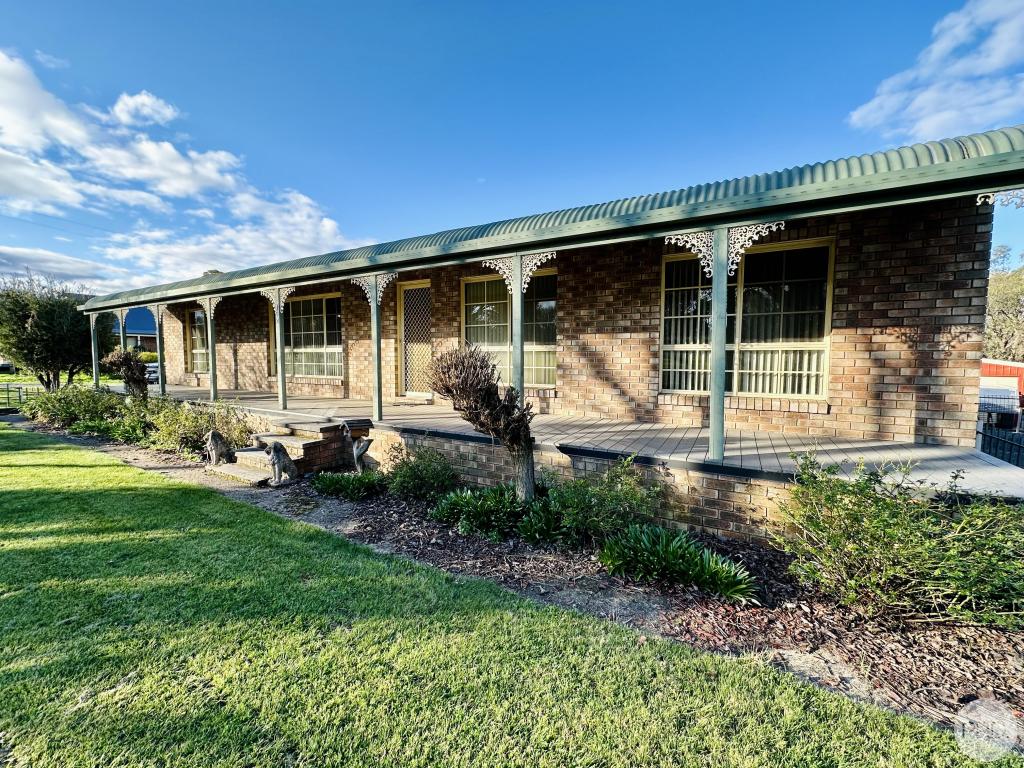 0
0
 0
0
 0
0Similar properties For Sale nearby
See more properties for sale nearby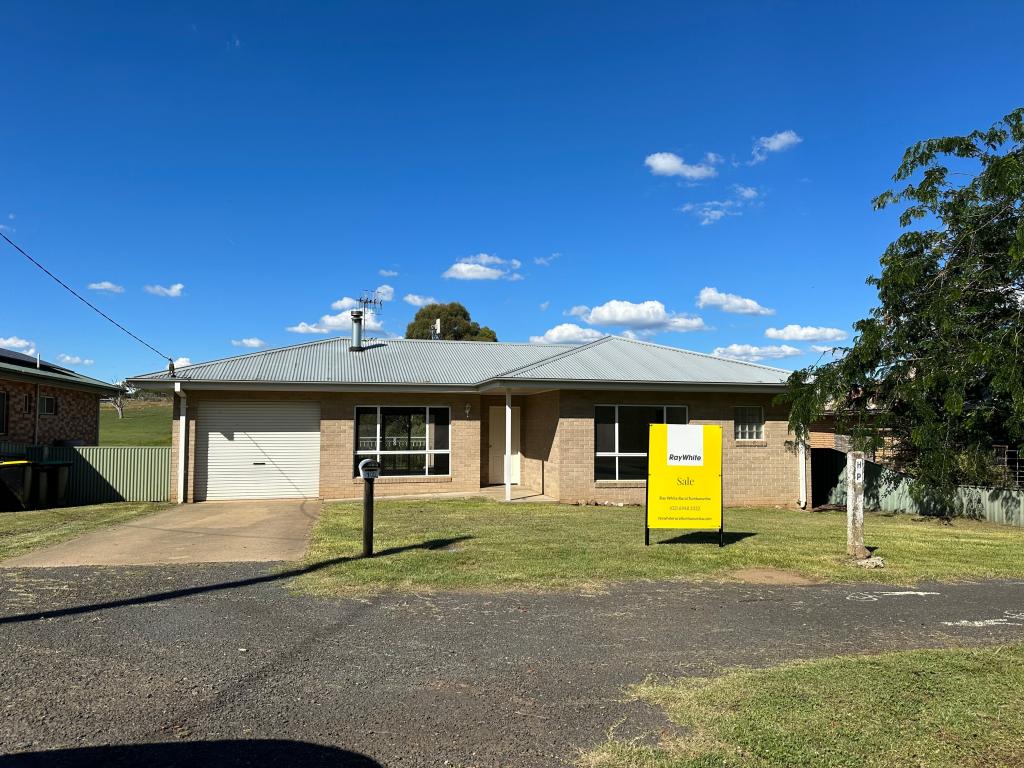 0
0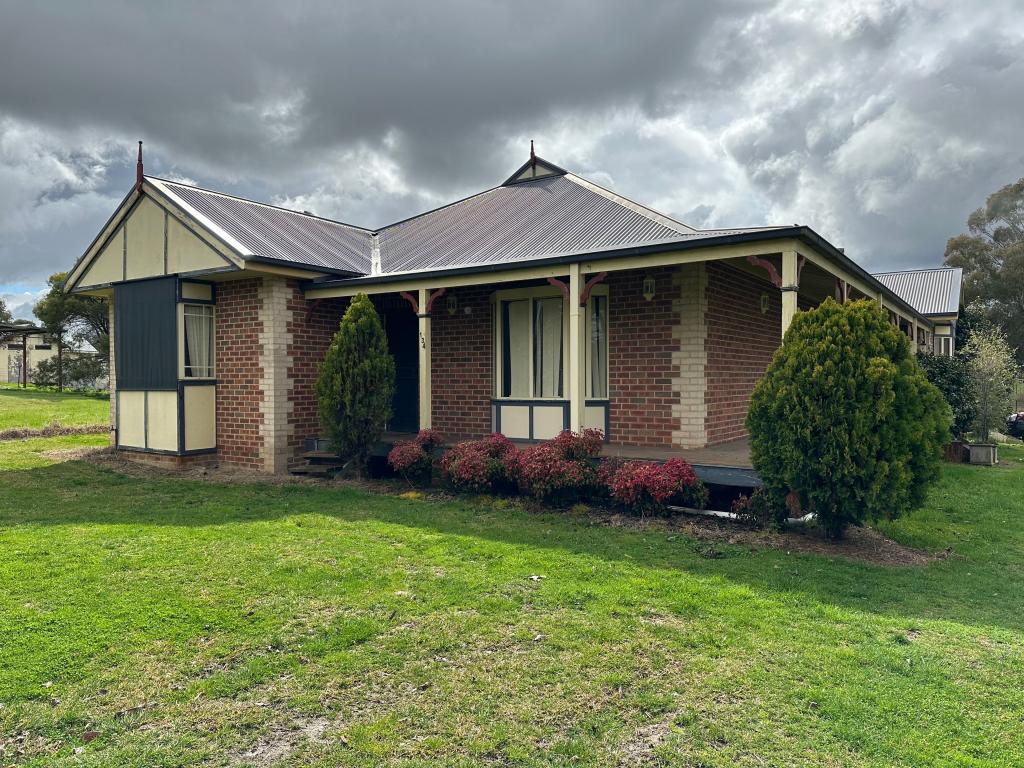 0
0 0
0Similar properties For Rent nearby
See more properties for rent nearby 0
0 0
0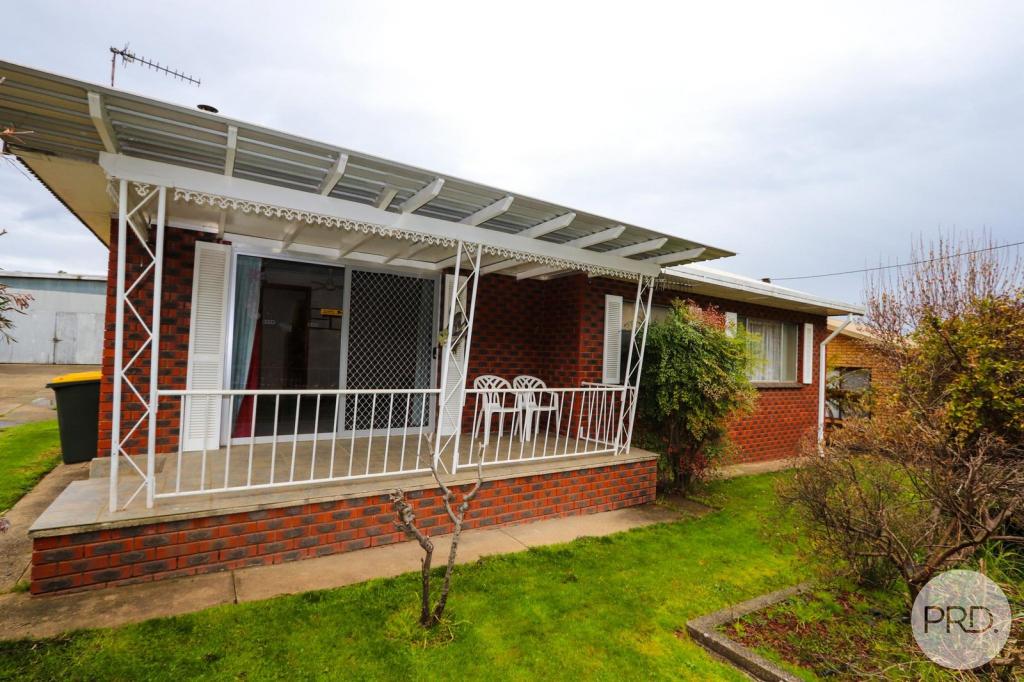 0
0About Tumbarumba 2653
The size of Tumbarumba is approximately 231.7 square kilometres. It has 6 parks covering nearly 48.4% of total area. The population of Tumbarumba in 2011 was 1,756 people. By 2016 the population was 1,844 showing a population growth of 5.0% in the area during that time. The predominant age group in Tumbarumba is 50-59 years. Households in Tumbarumba are primarily childless couples and are likely to be repaying $1000 - $1399 per month on mortgage repayments. In general, people in Tumbarumba work in a labourer occupation. In 2011, 66.8% of the homes in Tumbarumba were owner-occupied compared with 68.7% in 2016.
Tumbarumba has 1,325 properties. Over the last 5 years, Houses in Tumbarumba have seen a 65.31% increase in median value, while Units have seen a 48.75% increase. As at 31 October 2024:
- The median value for Houses in Tumbarumba is $309,126 while the median value for Units is $339,953.
- Houses have a median rent of $390 while Units have a median rent of $175.
Suburb Insights for Tumbarumba 2653
Market Insights
Tumbarumba Trends for Houses
N/A
N/A
View TrendN/A
N/A
Tumbarumba Trends for Units
N/A
N/A
View TrendN/A
N/A
Neighbourhood Insights
© Copyright 2024 RP Data Pty Ltd trading as CoreLogic Asia Pacific (CoreLogic). All rights reserved.
This product uses cookies and other similar technologies to improve and customise your browsing experience, to tailor content and adverts, and for analytics and metrics regarding visitor usage on this product and other media. We may share cookie and analytics information with third parties for the purposes of advertising. By continuing to use our website, you consent to cookies being used. View our Privacy Policy here.
X