55 Nixon CrescentTolland NSW 2650
Property Details for 55 Nixon Cres, Tolland
55 Nixon Cres, Tolland is a 3 bedroom, 1 bathroom House with 1 parking spaces and was built in 1970. The property has a land size of 715m2 and floor size of 110m2. While the property is not currently for sale or for rent, it was last sold in April 2010.
Last Listing description (June 2013)
RENOVATED HOUSE
THIS RENOVATED 3 BEDROOM HOME IS PERFECT FOR THE EXECUTIVE COUPLE OR FAMILY.- 3 GOOD SIZE BEDROOM ALL WITH BUILT IN ROBES- FRESHLY PAINTED- GOOD SIZE LOUNGE ROOM- RENOVATED KITCHEN WITH GAS COOKING AND DISHWASHER- SEPARATE DINING- DUCTED COOLING AND GAS BAYONET HEATING- TASTEFULLY RENOVATED BATHROOM- GOOD SIZE DECK OVERLOOKING HUGE BACK YARD- SINGLE LOCK UP GARAGE AND GARDEN SHED
Property History for 55 Nixon Cres, Tolland, NSW 2650
- 26 May 2020Sold
- 22 May 2013Listed for Rent $310 / week
- 10 Feb 2012Listed for Rent - Price not available
Commute Calculator
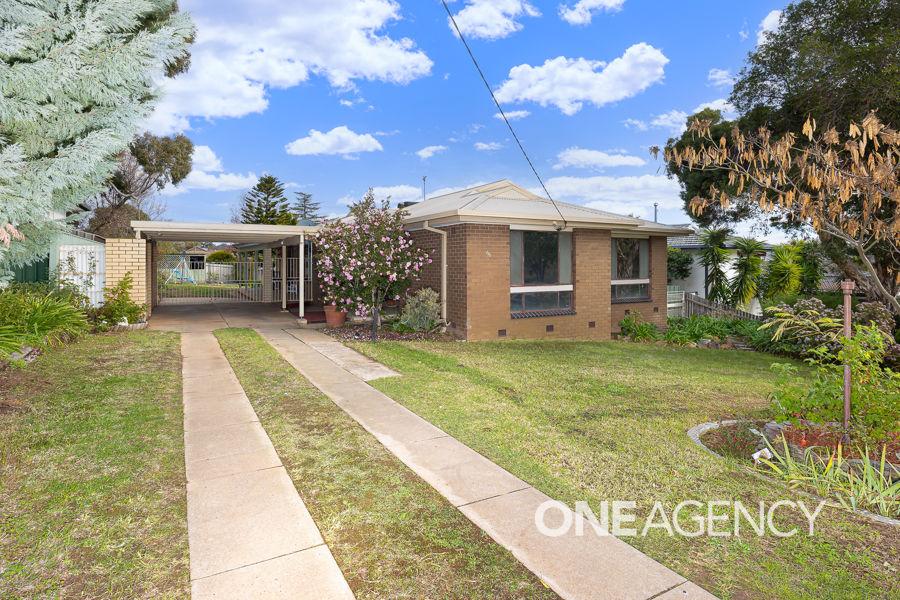
Recent sales nearby
See more recent sales nearby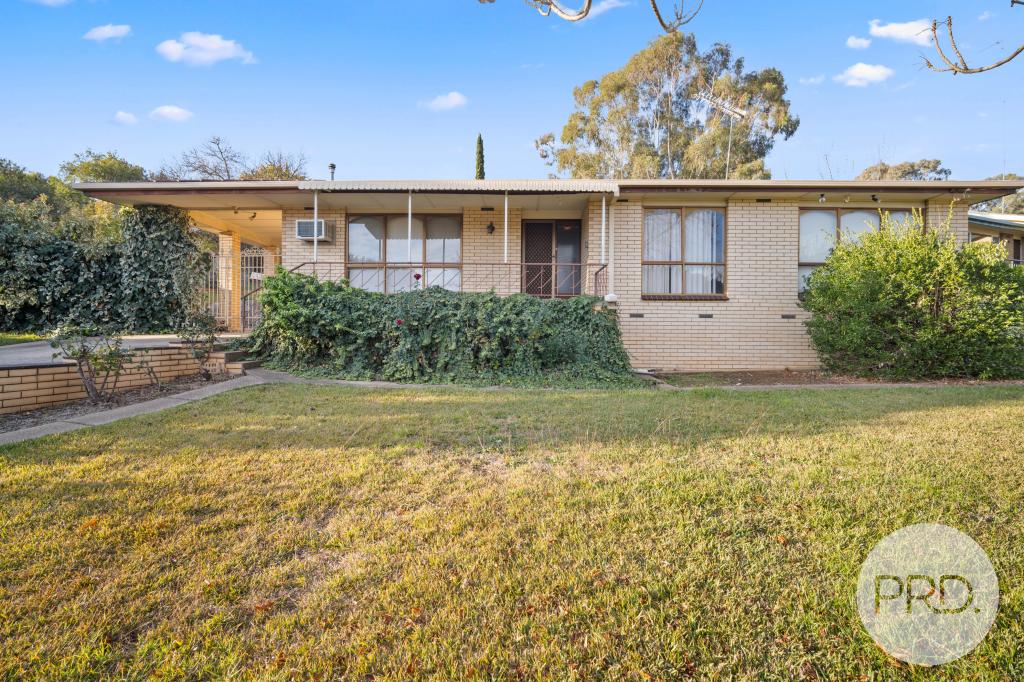 0
0
 0
0Similar properties For Sale nearby
See more properties for sale nearby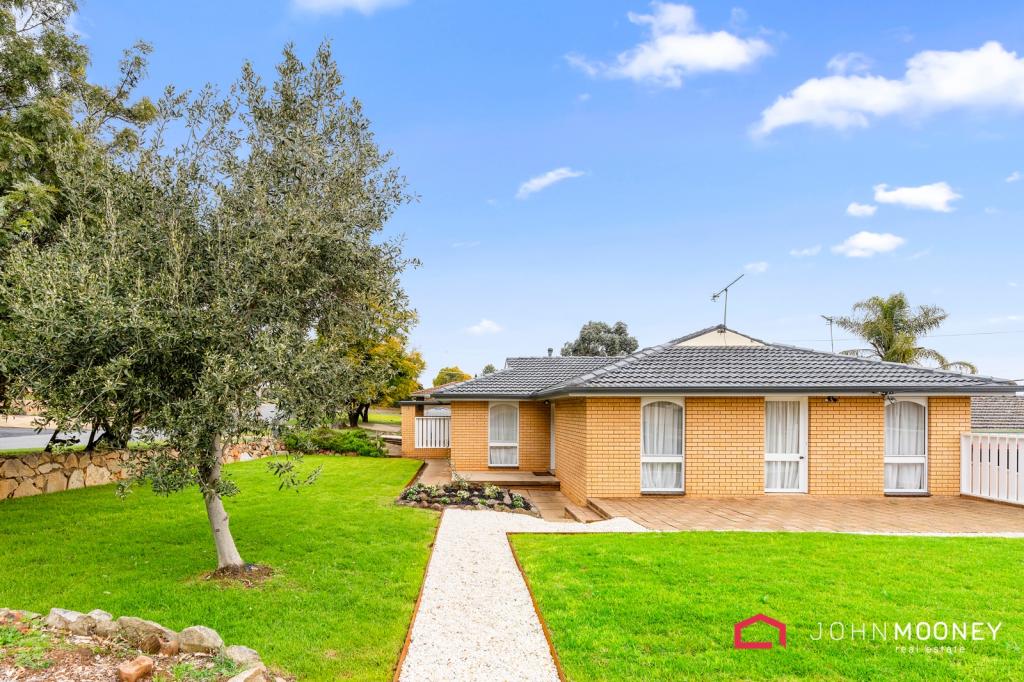 0
0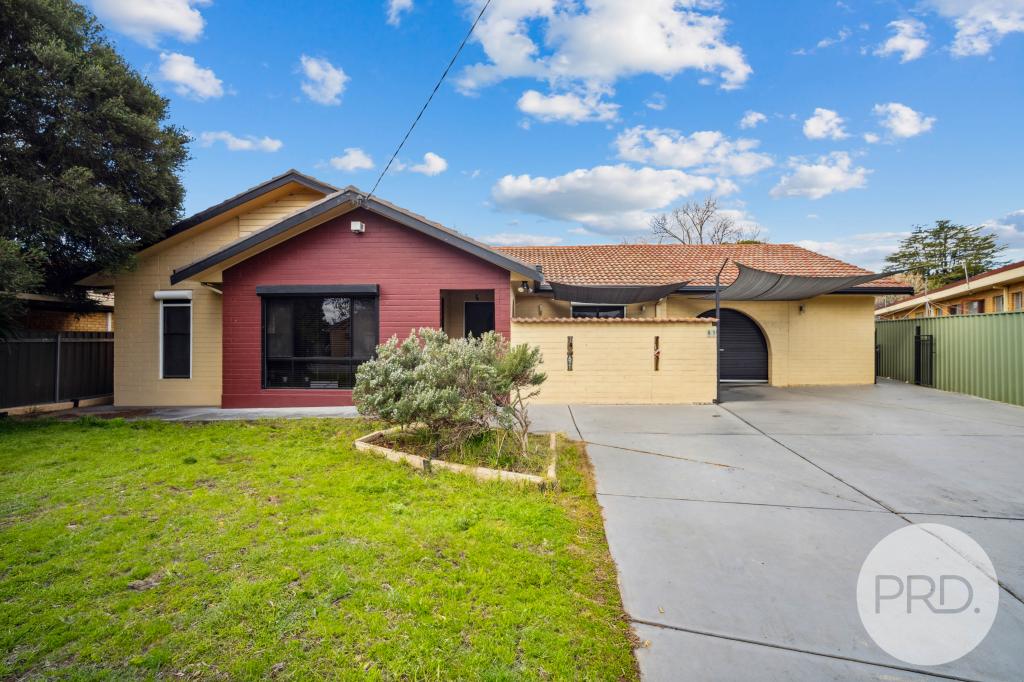 0
0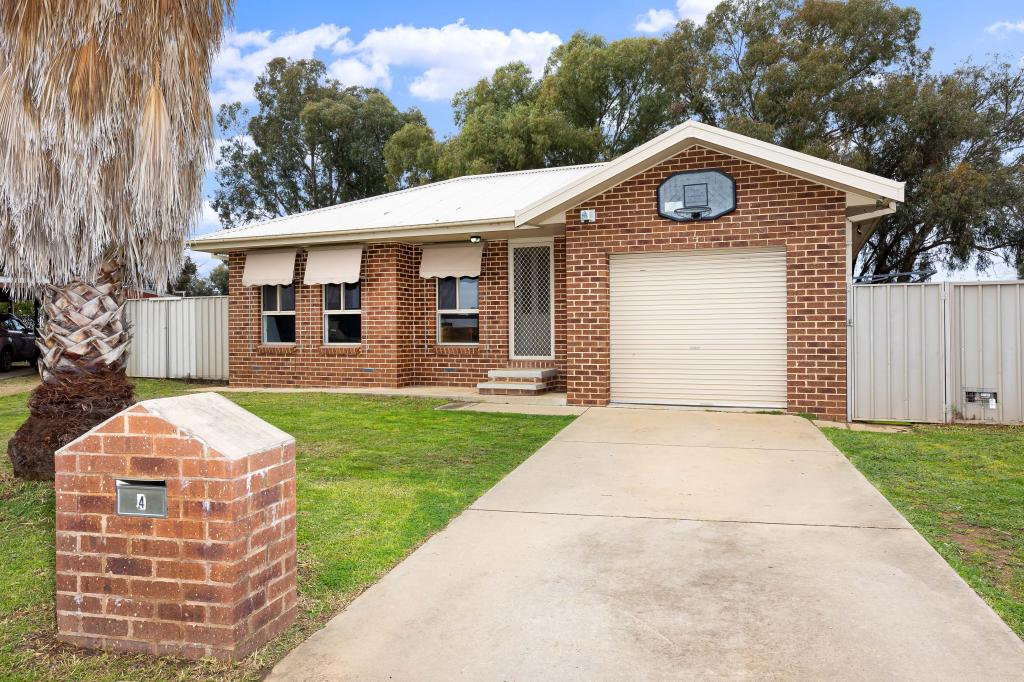 0
0Similar properties For Rent nearby
See more properties for rent nearby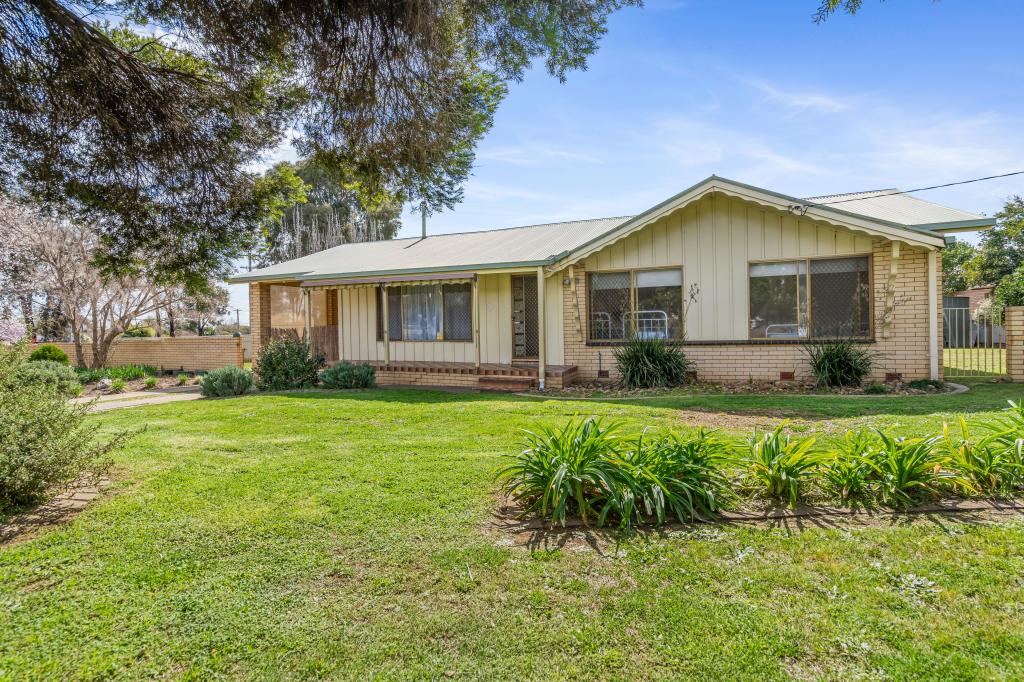 0
0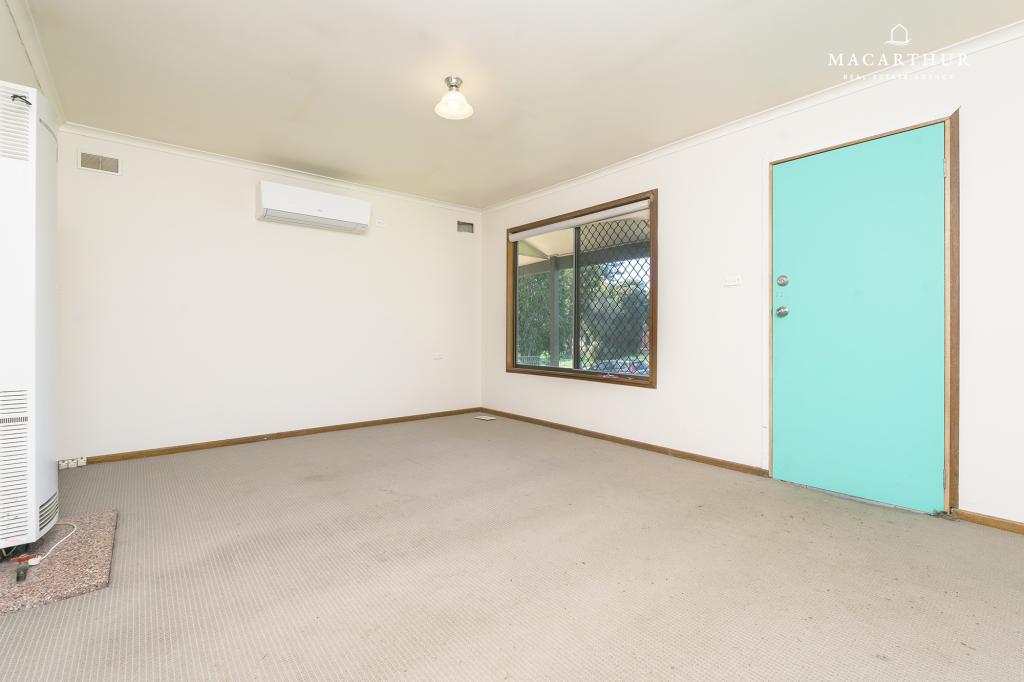 0
0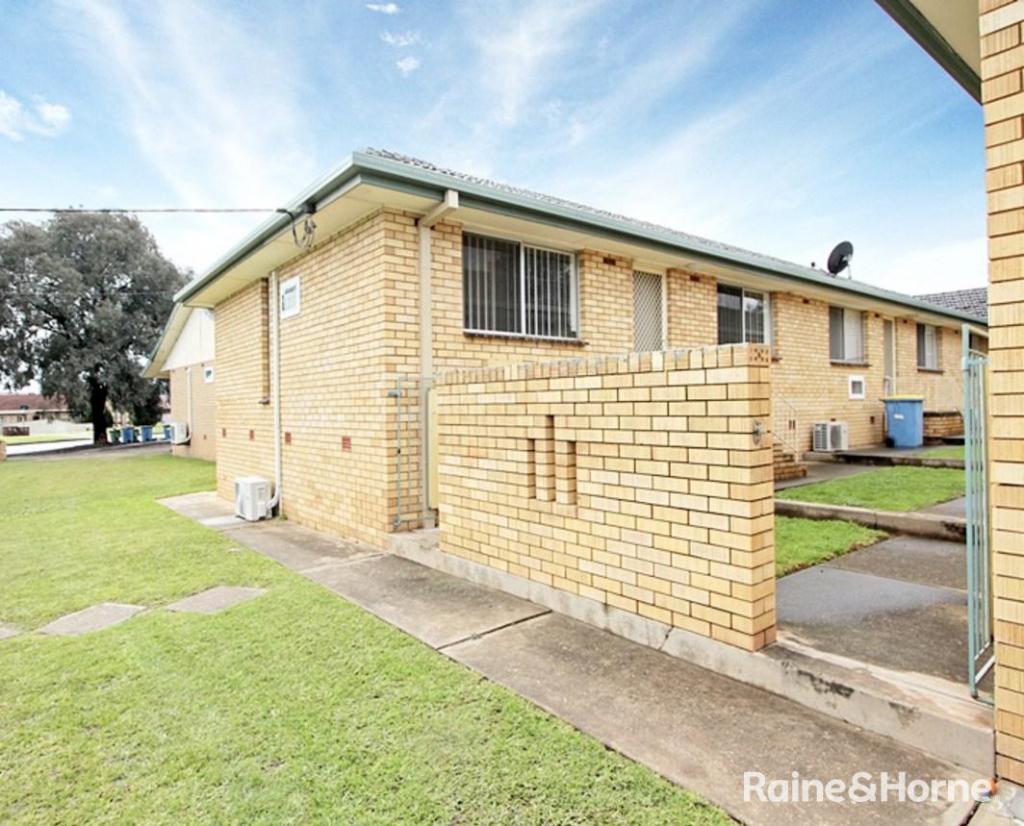 0
0About Tolland 2650
The size of Tolland is approximately 2 square kilometres. It has 4 parks covering nearly 11.9% of total area. The population of Tolland in 2011 was 3,550 people. By 2016 the population was 3,363 showing a population decline of 5.3% in the area during that time. The predominant age group in Tolland is 0-9 years. Households in Tolland are primarily childless couples and are likely to be repaying $1000 - $1399 per month on mortgage repayments. In general, people in Tolland work in a labourer occupation. In 2011, 54.9% of the homes in Tolland were owner-occupied compared with 51.6% in 2016.
Tolland has 1,694 properties. Over the last 5 years, Houses in Tolland have seen a 72.75% increase in median value, while Units have seen a 67.75% increase. As at 31 July 2024:
- The median value for Houses in Tolland is $459,392 while the median value for Units is $342,793.
- Houses have a median rent of $440 while Units have a median rent of $300.
Suburb Insights for Tolland 2650
Market Insights
Tolland Trends for Houses
N/A
N/A
View TrendN/A
N/A
Tolland Trends for Units
N/A
N/A
View TrendN/A
N/A
Neighbourhood Insights
© Copyright 2024 RP Data Pty Ltd trading as CoreLogic Asia Pacific (CoreLogic). All rights reserved.
This product uses cookies and other similar technologies to improve and customise your browsing experience, to tailor content and adverts, and for analytics and metrics regarding visitor usage on this product and other media. We may share cookie and analytics information with third parties for the purposes of advertising. By continuing to use our website, you consent to cookies being used. View our Privacy Policy here.
X