2 O'Connor StreetTolland NSW 2650
Property Details for 2 O'Connor St, Tolland
2 O'Connor St, Tolland is a 3 bedroom, 1 bathroom House with 2 parking spaces. The property has a land size of 774m2 and floor size of 122m2. While the property is not currently for sale or for rent, it was last sold in April 2022.
Last Listing description (October 2023)
This beautifully renovated 3 bedroom home in the heart of Tolland is ready to meet its new tenants, with its sophisticated style and low maintenance living it sure wont last long on our market. Features include:
3 bedrooms, all with built in robes and ceiling fans
Main bathroom, with bath and seperate toilet
Additional toilet in laundry
Double lock up garage
Split system heating and cooling
Large outdoor secure yard
Lawn mower included, please note this will not be replaced to fixed
Property History for 2 O'Connor St, Tolland, NSW 2650
- 12 Oct 2023Listed for Rent $470 / week
- 08 Apr 2022Sold for $334,000
- 17 Feb 2022Listed for Sale $319,900
Commute Calculator
Recent sales nearby
See more recent sales nearby 0
0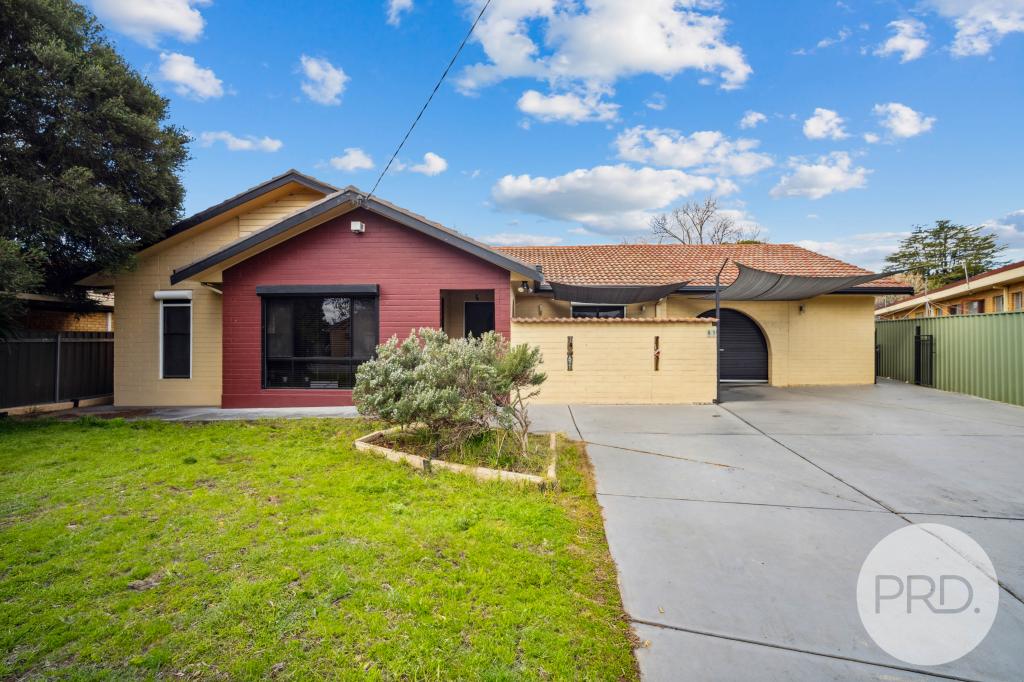 0
0Similar properties For Sale nearby
See more properties for sale nearby 0
0 0
0 0
0
Similar properties For Rent nearby
See more properties for rent nearby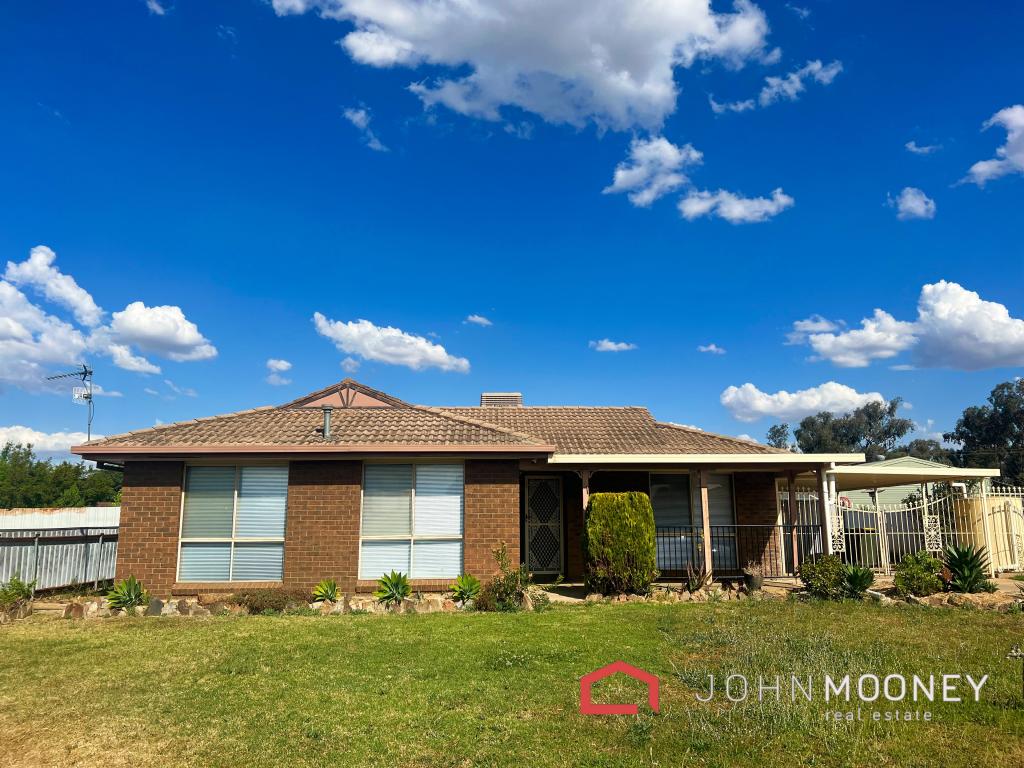 0
0 0
0 0
0About Tolland 2650
The size of Tolland is approximately 2 square kilometres. It has 4 parks covering nearly 11.9% of total area. The population of Tolland in 2011 was 3,550 people. By 2016 the population was 3,363 showing a population decline of 5.3% in the area during that time. The predominant age group in Tolland is 0-9 years. Households in Tolland are primarily childless couples and are likely to be repaying $1000 - $1399 per month on mortgage repayments. In general, people in Tolland work in a labourer occupation. In 2011, 54.9% of the homes in Tolland were owner-occupied compared with 51.6% in 2016.
Tolland has 1,685 properties. Over the last 5 years, Houses in Tolland have seen a 80.88% increase in median value, while Units have seen a 73.85% increase. As at 31 October 2024:
- The median value for Houses in Tolland is $461,675 while the median value for Units is $353,674.
- Houses have a median rent of $450 while Units have a median rent of $320.
Suburb Insights for Tolland 2650
Market Insights
Tolland Trends for Houses
N/A
N/A
View TrendN/A
N/A
Tolland Trends for Units
N/A
N/A
View TrendN/A
N/A
Neighbourhood Insights
© Copyright 2024 RP Data Pty Ltd trading as CoreLogic Asia Pacific (CoreLogic). All rights reserved.
This product uses cookies and other similar technologies to improve and customise your browsing experience, to tailor content and adverts, and for analytics and metrics regarding visitor usage on this product and other media. We may share cookie and analytics information with third parties for the purposes of advertising. By continuing to use our website, you consent to cookies being used. View our Privacy Policy here.
X