803/20 Pelican StreetSurry Hills NSW 2010
Property Details for 803/20 Pelican St, Surry Hills
803/20 Pelican St, Surry Hills is a 3 bedroom, 2 bathroom Unit with 2 parking spaces and was built in 2004. The property has a land size of 34m2 and floor size of 116m2. While the property is not currently for sale or for rent, it was last sold in March 2021.
Last Listing description (August 2021)
Sold - All open for Inspections are cancelled.
In the historic heart of one of the world's most renowned cultural precincts, this unique residence presents a contemporary home designed for the effortless entertaining lifestyle. Occupying a prized elevated setting, benefit from amazing views stretching out all the way to the Opera House Sails.
- Sun-washed open combined lounge and dining area
- Spacious master with built-ins, ensuite and plenty of space
- Chic kitchen, CaesarStone benches, Miele appliances
- Video intercom, 2 secure parking spaces
- Manicured roof gardens, heated pool, concierge, gym
Conveniently set no more than moments to Hyde Park, museums, restaurants, trains and the CBD, this quality offering is ideal for the investor or professional couple that seeks a low maintenance lifestyle.
Outgoings:
Water Rates: $150 p/q approx.
Council Rates: $243 p/q approx.
Strata Levies: $2,604 p/q approx.
In a continuing effort to help stop the spread of COVID-19, we will conduct our scheduled open homes with social distancing and hygiene protocols in place, as well as continue to offer private appointments for those who prefer that method.
Please contact the listing agent for more information.
Property History for 803/20 Pelican St, Surry Hills, NSW 2010
- 19 Mar 2021Sold for $2,218,000
- 05 Mar 2021Listed for Sale SOLD - Contact Agent
- 23 Aug 2013Sold for $1,400,000
Commute Calculator
Recent sales nearby
See more recent sales nearbySimilar properties For Sale nearby
See more properties for sale nearby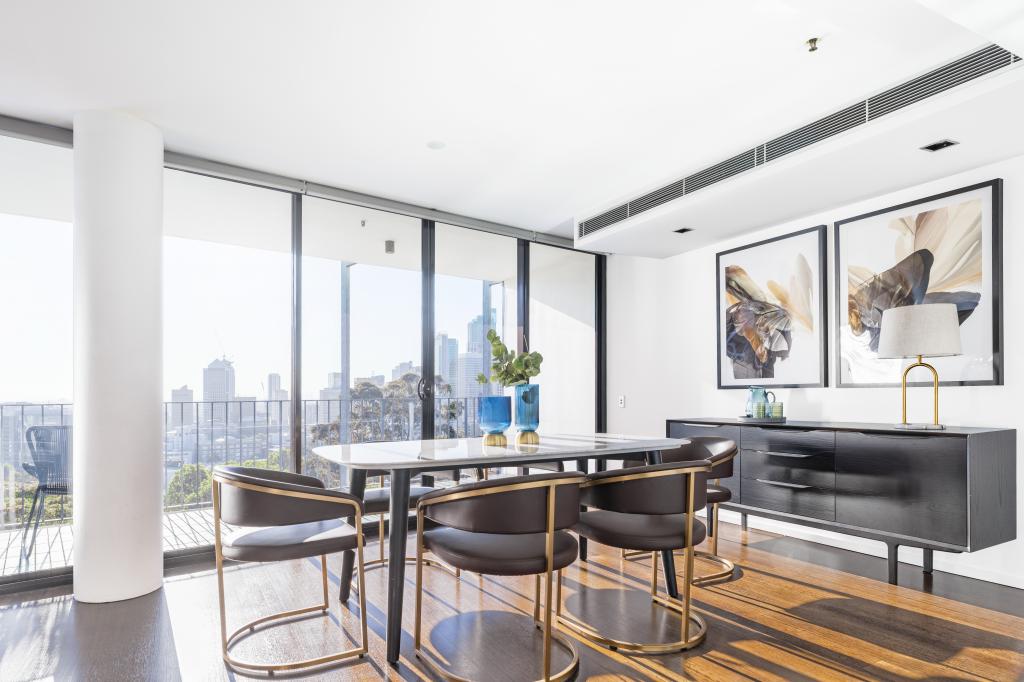 0
0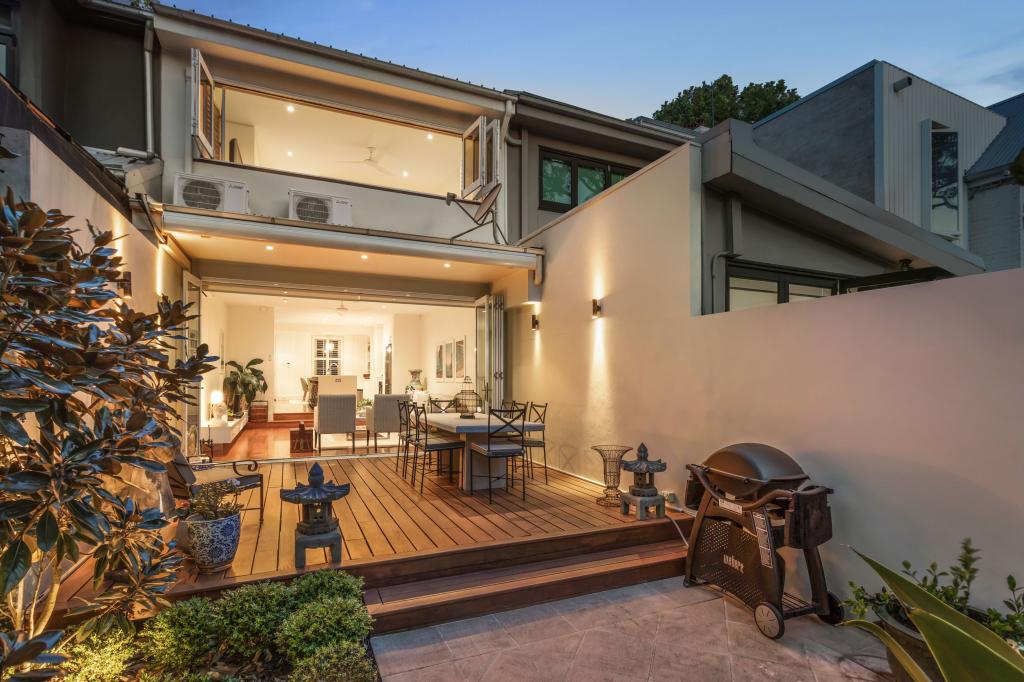 0
0 0
0Similar properties For Rent nearby
See more properties for rent nearby 0
0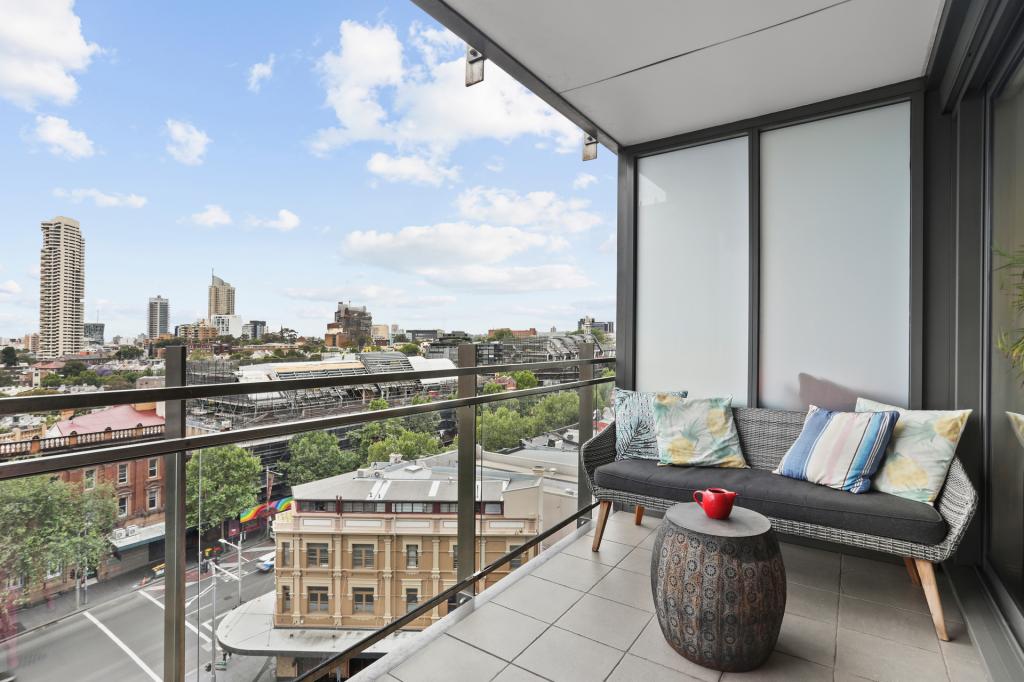 0
0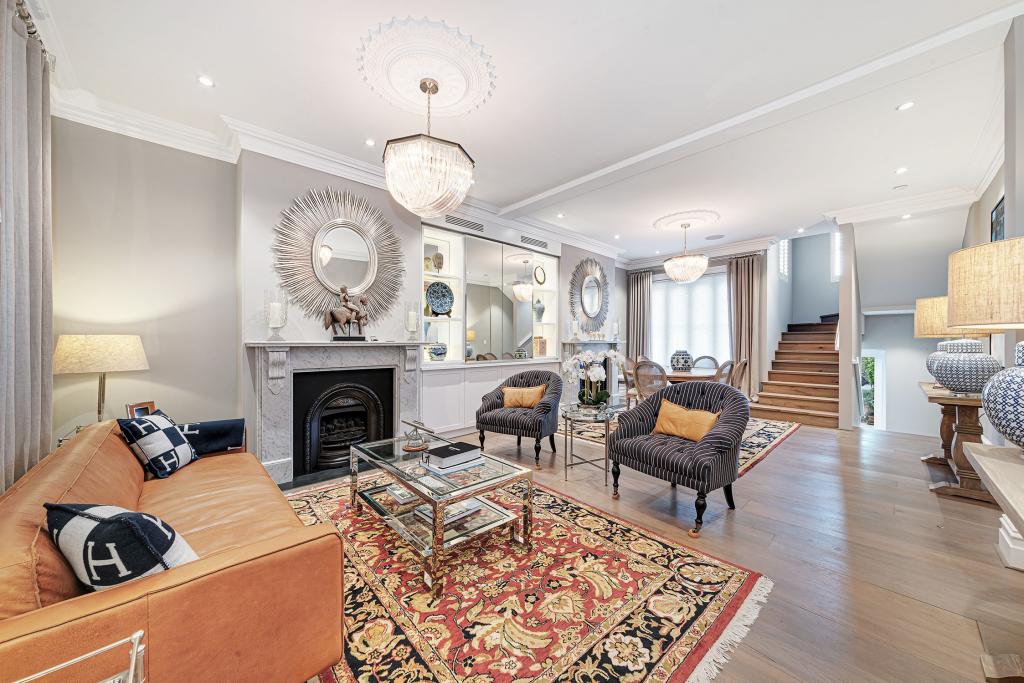 0
0About Surry Hills 2010
The size of Surry Hills is approximately 1.3 square kilometres. It has 17 parks covering nearly 9.2% of total area. The population of Surry Hills in 2011 was 15,342 people. By 2016 the population was 16,417 showing a population growth of 7.0% in the area during that time. The predominant age group in Surry Hills is 30-39 years. Households in Surry Hills are primarily childless couples and are likely to be repaying over $4000 per month on mortgage repayments. In general, people in Surry Hills work in a professional occupation. In 2011, 34.9% of the homes in Surry Hills were owner-occupied compared with 32.3% in 2016.
Surry Hills has 13,548 properties. Over the last 5 years, Houses in Surry Hills have seen a 32.93% increase in median value, while Units have seen a 11.66% increase. As at 31 October 2024:
- The median value for Houses in Surry Hills is $2,287,029 while the median value for Units is $994,383.
- Houses have a median rent of $980 while Units have a median rent of $750.
Suburb Insights for Surry Hills 2010
Market Insights
Surry Hills Trends for Houses
N/A
N/A
View TrendN/A
N/A
Surry Hills Trends for Units
N/A
N/A
View TrendN/A
N/A
Neighbourhood Insights
© Copyright 2024 RP Data Pty Ltd trading as CoreLogic Asia Pacific (CoreLogic). All rights reserved.
This product uses cookies and other similar technologies to improve and customise your browsing experience, to tailor content and adverts, and for analytics and metrics regarding visitor usage on this product and other media. We may share cookie and analytics information with third parties for the purposes of advertising. By continuing to use our website, you consent to cookies being used. View our Privacy Policy here.
X