7/165 Clyde StreetSouth Granville NSW 2142
Property Details for 7/165 Clyde St, South Granville
7/165 Clyde St, South Granville is a 2 bedroom, 2 bathroom Unit with 1 parking spaces and was built in 2014. The property has a land size of 141m2 and floor size of 93m2. While the property is not currently for sale or for rent, it was last sold in May 2017.
Last Listing description (November 2021)
This spacious 2 bedroom apartment is surely not to be missed, the unit has all features you need and want in an apartment for convenient living.
The apartment is situated near local parks, shops and transport.
Key features are:
-2 large size bedrooms with built-ins and en-suit to the master room
- Open plan living and dining area that opens out to a fantastic balcony
- Modern kitchen with stainless steel to applicant and gas cooktop
-Decent size bathroom with tiles throughout
-High maintained building with lift access and secure car space
Property History for 7/165 Clyde St, South Granville, NSW 2142
- 08 Oct 2021Listed for Rent - Price not available
- 14 Mar 2019Listed for Rent $450 / week
- 19 Jun 2017Listed for Rent $450 / week
Commute Calculator
Recent sales nearby
See more recent sales nearby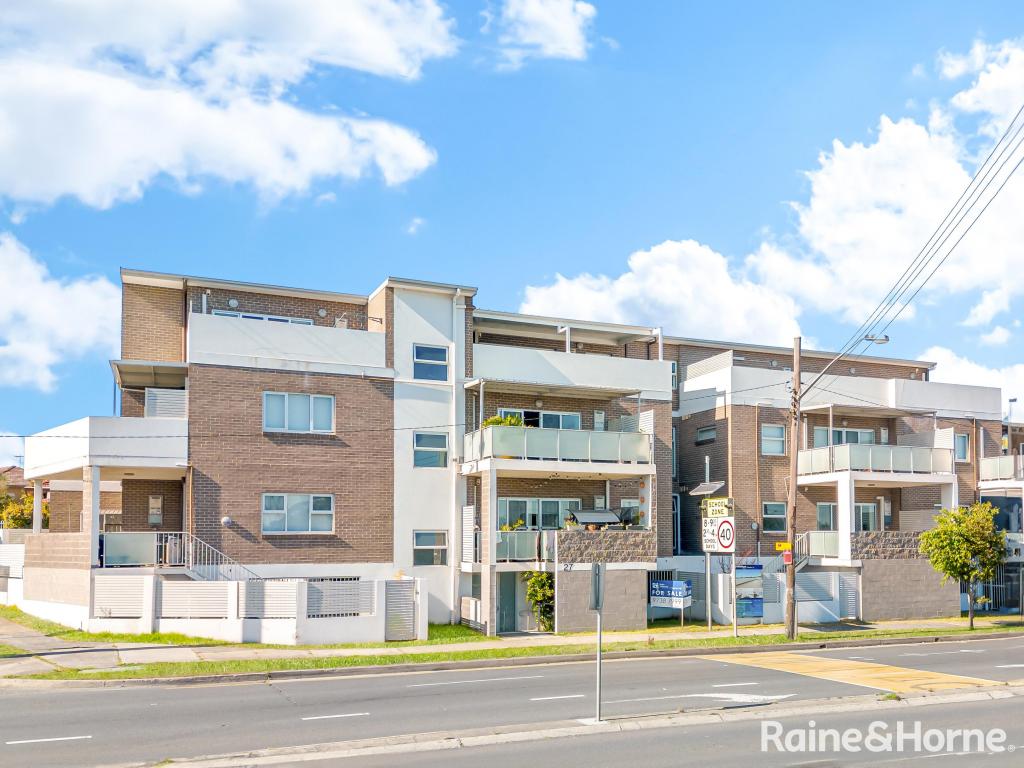 0
0Similar properties For Sale nearby
See more properties for sale nearby 0
0 0
0 0
0Similar properties For Rent nearby
See more properties for rent nearby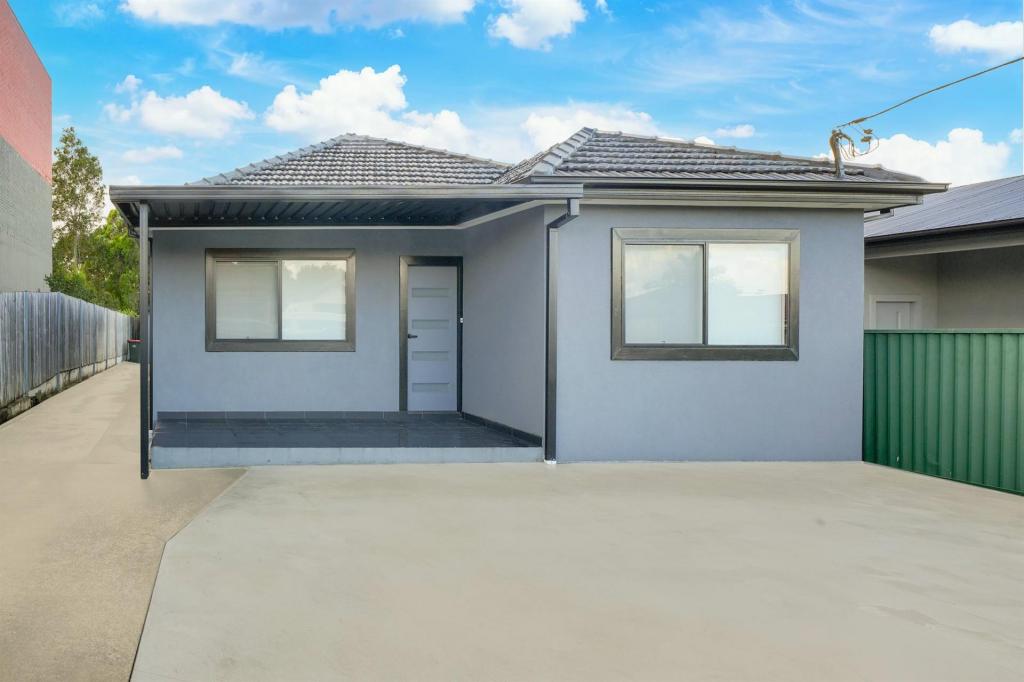 0
0 0
0 0
0About South Granville 2142
The size of South Granville is approximately 2.2 square kilometres. It has 15 parks covering nearly 20.4% of total area. The population of South Granville in 2011 was 4,852 people. By 2016 the population was 5,485 showing a population growth of 13.0% in the area during that time. The predominant age group in South Granville is 0-9 years. Households in South Granville are primarily couples with children and are likely to be repaying $1800 - $2399 per month on mortgage repayments. In general, people in South Granville work in a trades occupation. In 2011, 48.9% of the homes in South Granville were owner-occupied compared with 46.6% in 2016.
South Granville has 2,158 properties.
Suburb Insights for South Granville 2142
Market Insights
Trends for Houses
N/A
N/A
View TrendN/A
N/A
Trends for Units
N/A
N/A
View TrendN/A
N/A
Neighbourhood Insights
© Copyright 2024 RP Data Pty Ltd trading as CoreLogic Asia Pacific (CoreLogic). All rights reserved.
This product uses cookies and other similar technologies to improve and customise your browsing experience, to tailor content and adverts, and for analytics and metrics regarding visitor usage on this product and other media. We may share cookie and analytics information with third parties for the purposes of advertising. By continuing to use our website, you consent to cookies being used. View our Privacy Policy here.
X