39 Maubeuge StreetSouth Granville NSW 2142
Property Details for 39 Maubeuge St, South Granville
39 Maubeuge St, South Granville is a 1 bedroom, 1 bathroom House. The property has a land size of 177m2. While the property is not currently for sale or for rent, it was last sold in November 2022.
Last Listing description (June 2023)
Very Affordable
instructions from Endeavour Energy, this redundant substation building is being offered to the market for the first time in generations.
The site is zoned R2 amp; could potentially be used for storage/yard purposes or converted into a unique modern industrial New York loft style residence, studio/flat Subject to Council Approval.
Property History for 39 Maubeuge St, South Granville, NSW 2142
- 18 Dec 2022Listed for Sale SOLD AT AUCTION!
- 05 Nov 2022Sold for $360,000
- 12 Oct 2022Listed for Sale SOLD AT AUCTION!
Commute Calculator
Recent sales nearby
See more recent sales nearbySimilar properties For Sale nearby
See more properties for sale nearby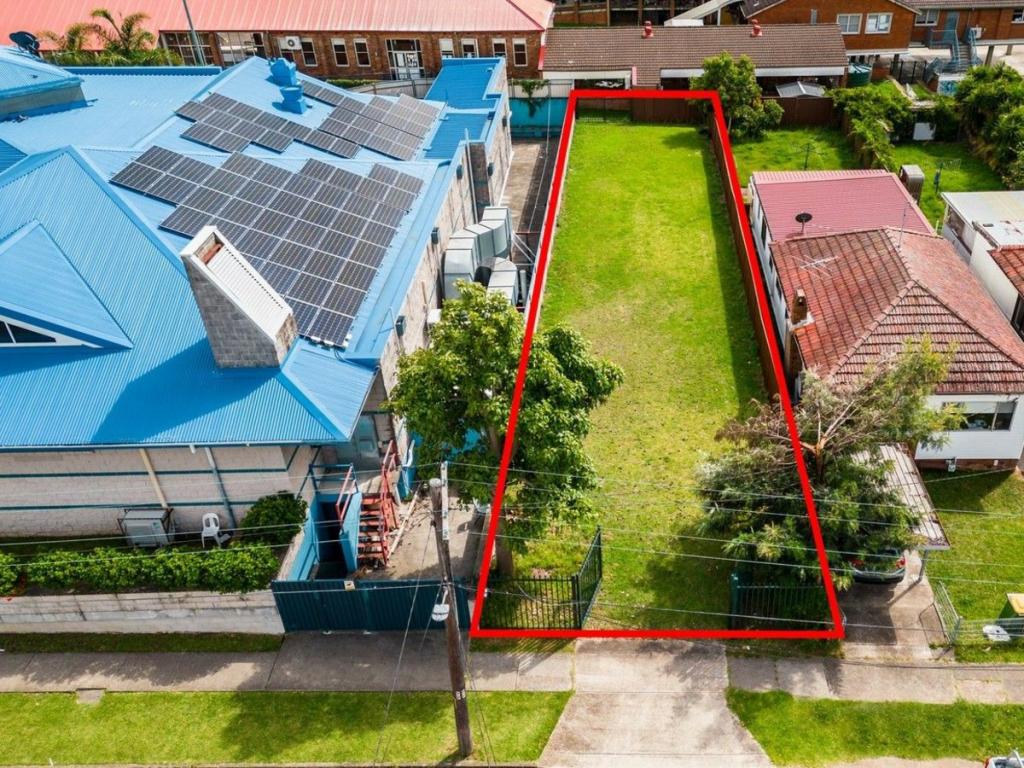 0
0 0
0 0
0Similar properties For Rent nearby
See more properties for rent nearby 0
0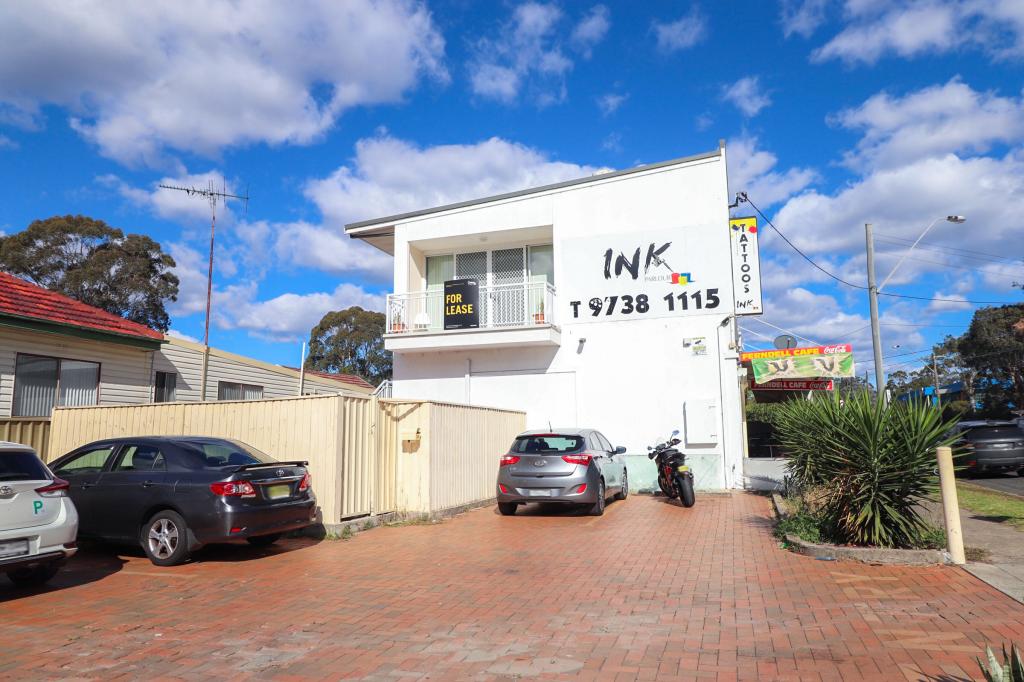 0
0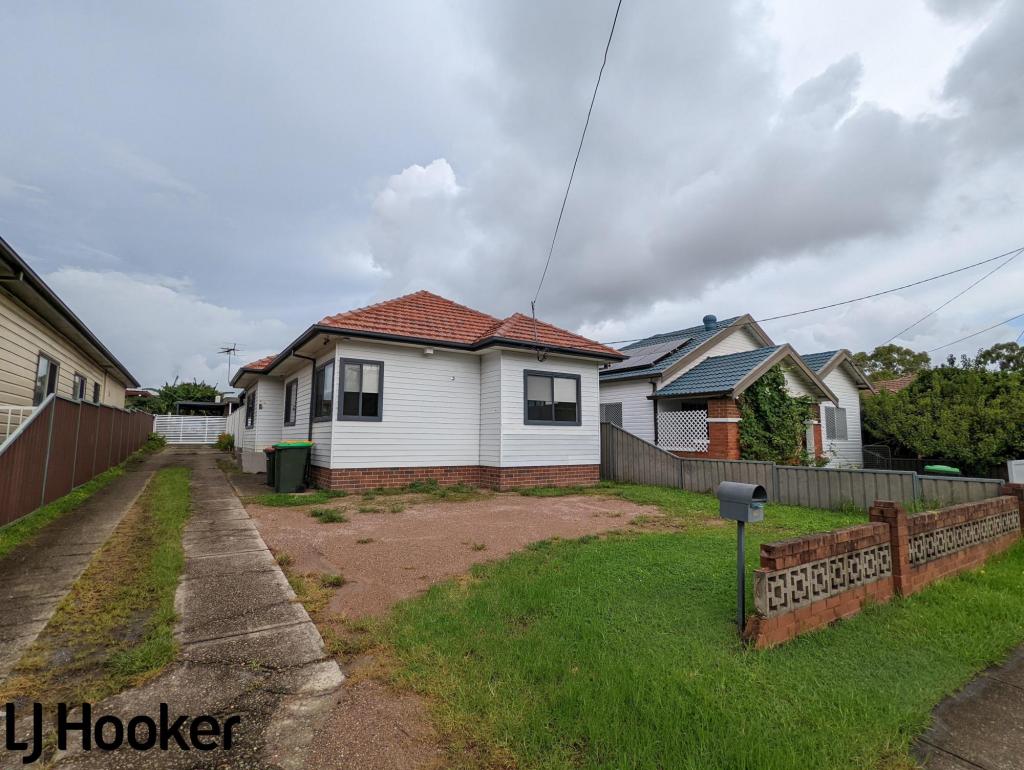 0
0
About South Granville 2142
The size of South Granville is approximately 2.2 square kilometres. It has 15 parks covering nearly 20.4% of total area. The population of South Granville in 2011 was 4,852 people. By 2016 the population was 5,485 showing a population growth of 13.0% in the area during that time. The predominant age group in South Granville is 0-9 years. Households in South Granville are primarily couples with children and are likely to be repaying $1800 - $2399 per month on mortgage repayments. In general, people in South Granville work in a trades occupation. In 2011, 48.9% of the homes in South Granville were owner-occupied compared with 46.6% in 2016.
South Granville has 2,158 properties.
Suburb Insights for South Granville 2142
Market Insights
Trends for Houses
N/A
N/A
View TrendN/A
N/A
Trends for Units
N/A
N/A
View TrendN/A
N/A
Neighbourhood Insights
© Copyright 2024 RP Data Pty Ltd trading as CoreLogic Asia Pacific (CoreLogic). All rights reserved.
This product uses cookies and other similar technologies to improve and customise your browsing experience, to tailor content and adverts, and for analytics and metrics regarding visitor usage on this product and other media. We may share cookie and analytics information with third parties for the purposes of advertising. By continuing to use our website, you consent to cookies being used. View our Privacy Policy here.
X