5/33 March StreetOrange NSW 2800
Property Details for 5/33 March St, Orange
5/33 March St, Orange is a 2 bedroom, 1 bathroom Unit with 1 parking spaces and was built in 2000. The property has a land size of 3847m2. While the property is not currently for sale or for rent, it was last sold in May 2011.
Last Listing description (July 2024)
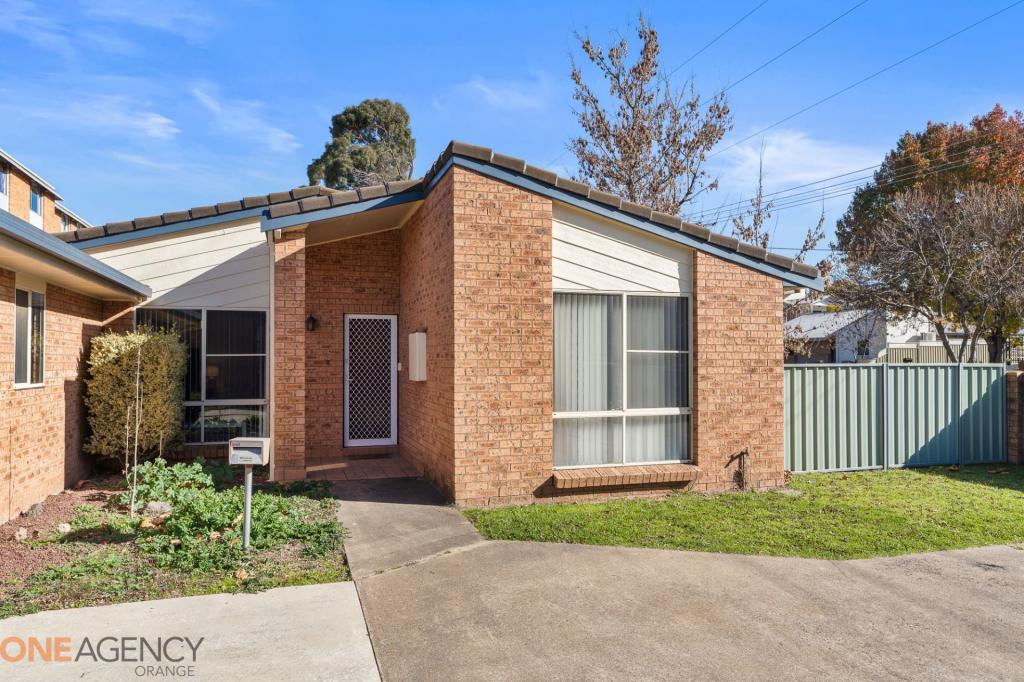
This two bedroom, free standing town house is situated in a sought after central location, close to Greengate Shops and the TAFE Campus. Featuring an open plan, spacious & sunny living room and meals area with electric heating and adjoining modern kitchen with wall oven and cooktop. The two bedrooms are spacious and offer BIW. The tiled bathroom has a separate toilet for convenience. There is a single lock-up garage attached with internal and remote access and the unit is set on a private back yard.
Property History for 5/33 March St, Orange, NSW 2800
- 11 Jul 2024Listed for Rent $450 / week
- 27 Mar 2015Listed for Rent $300 / week
- 11 Feb 2014Listed for Rent - Price not available
Commute Calculator
Recent sales nearby
See more recent sales nearby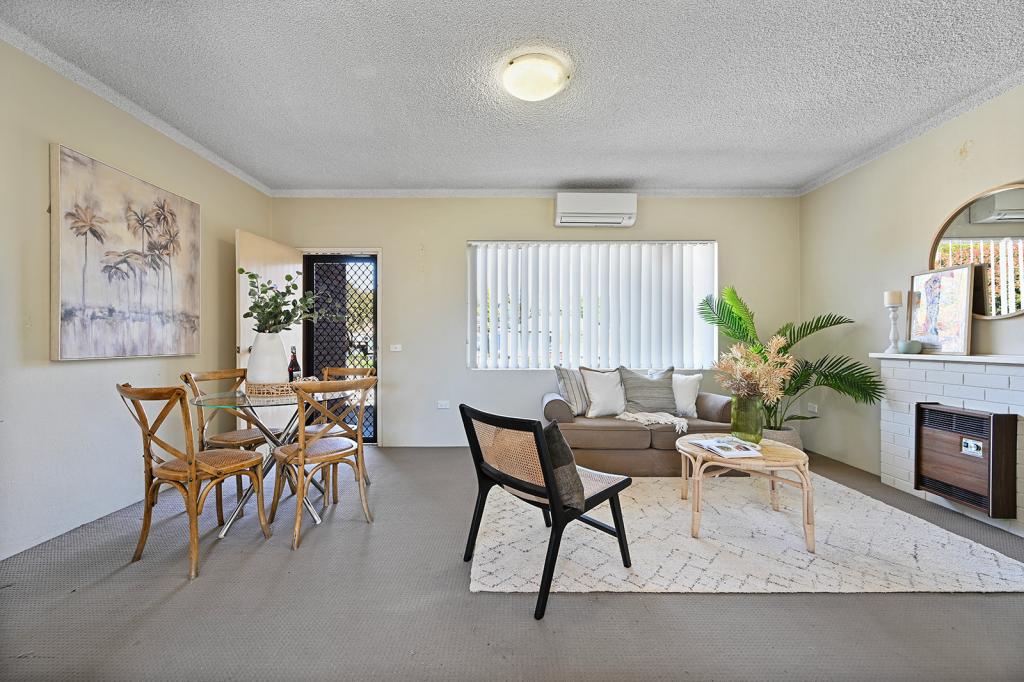 0
0
 0
0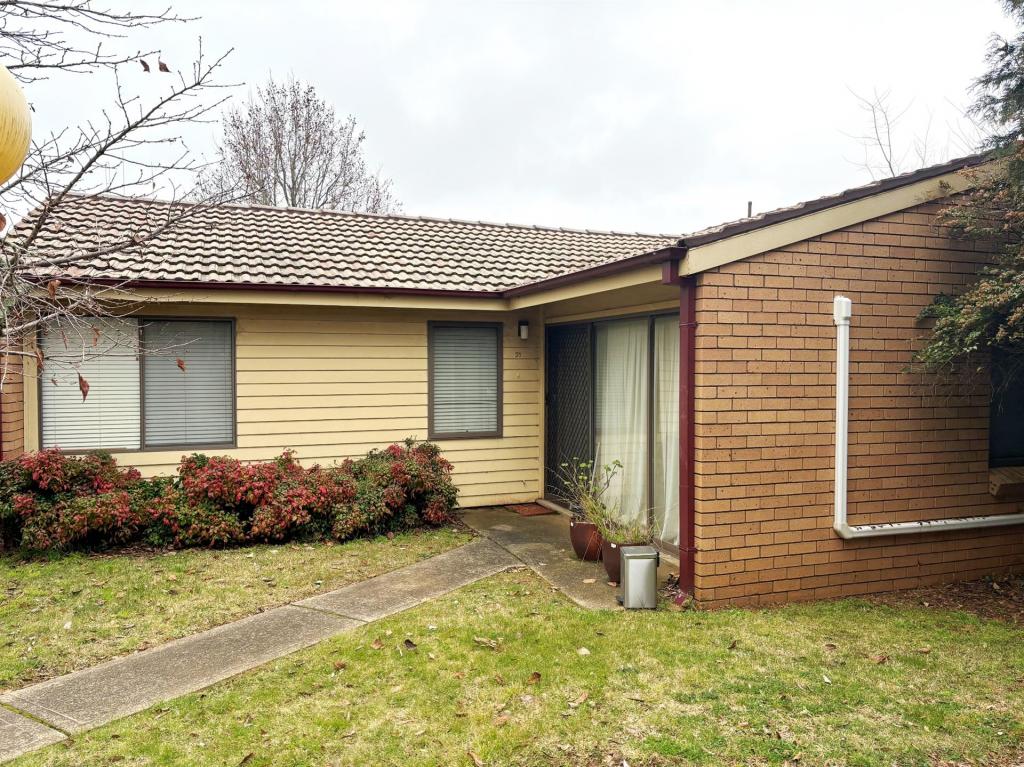 0
0Similar properties For Sale nearby
See more properties for sale nearby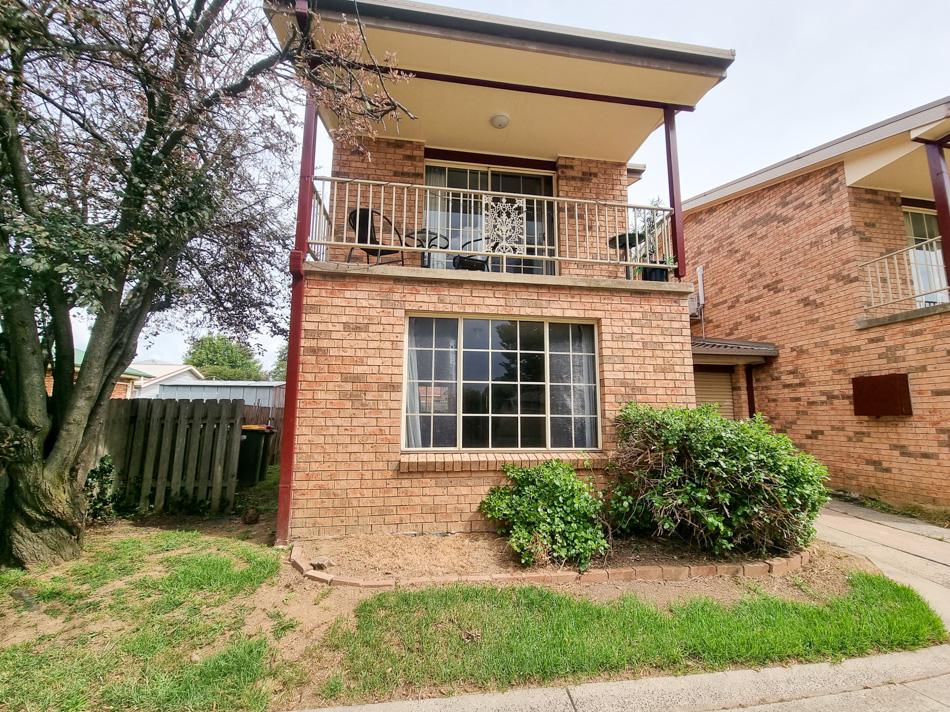 0
0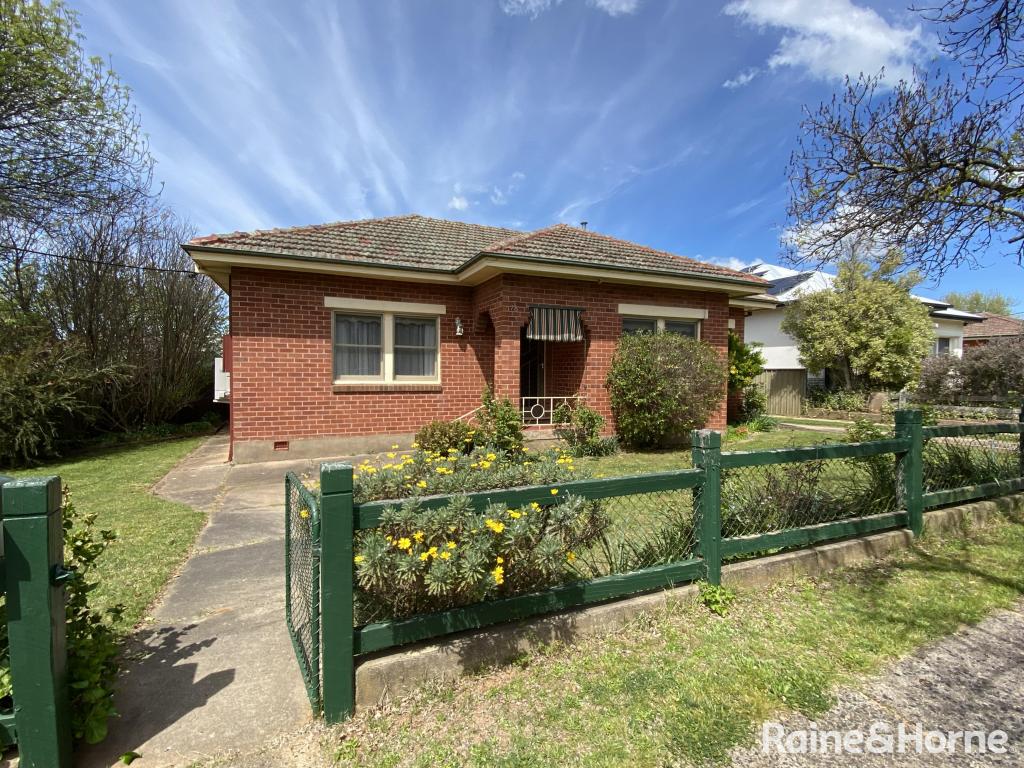 0
0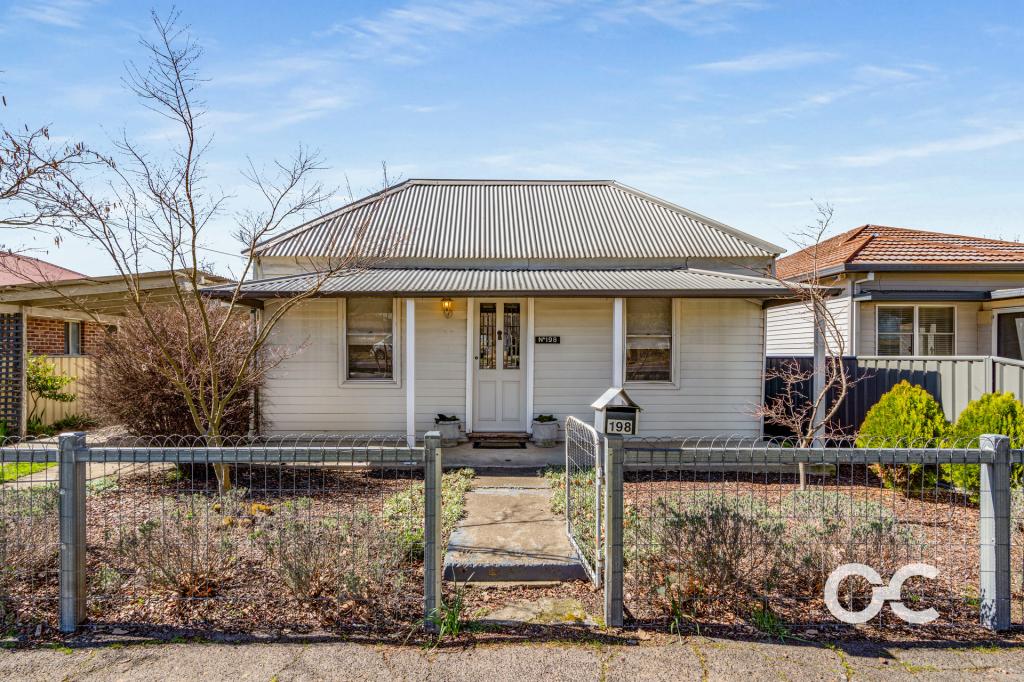 0
0Similar properties For Rent nearby
See more properties for rent nearby 0
0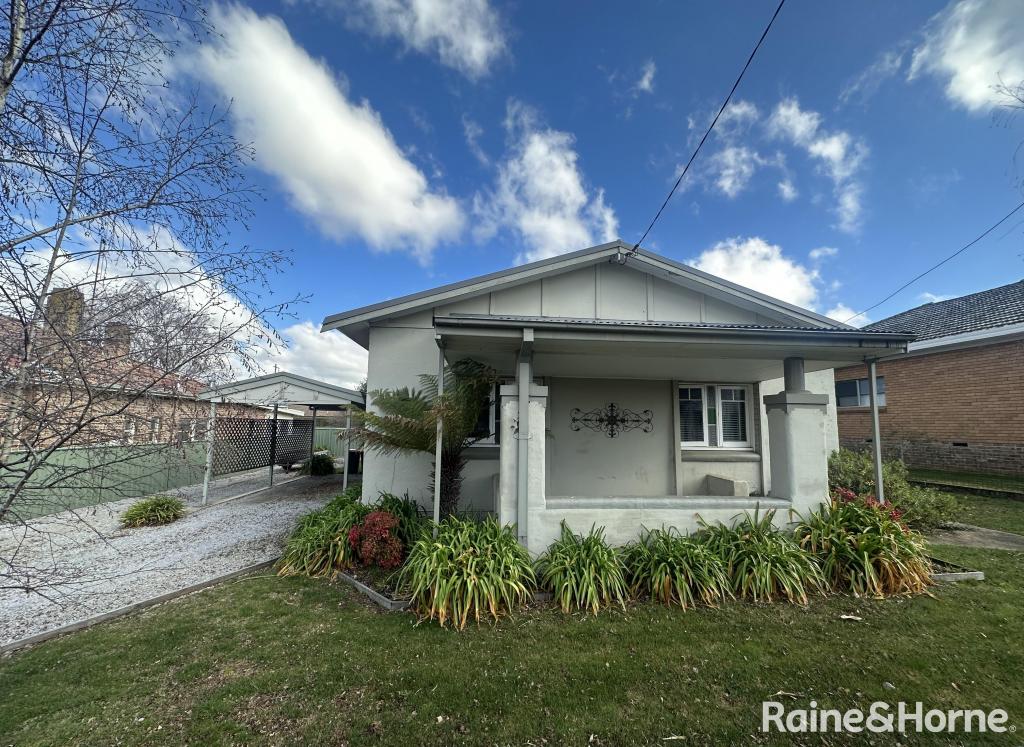 0
0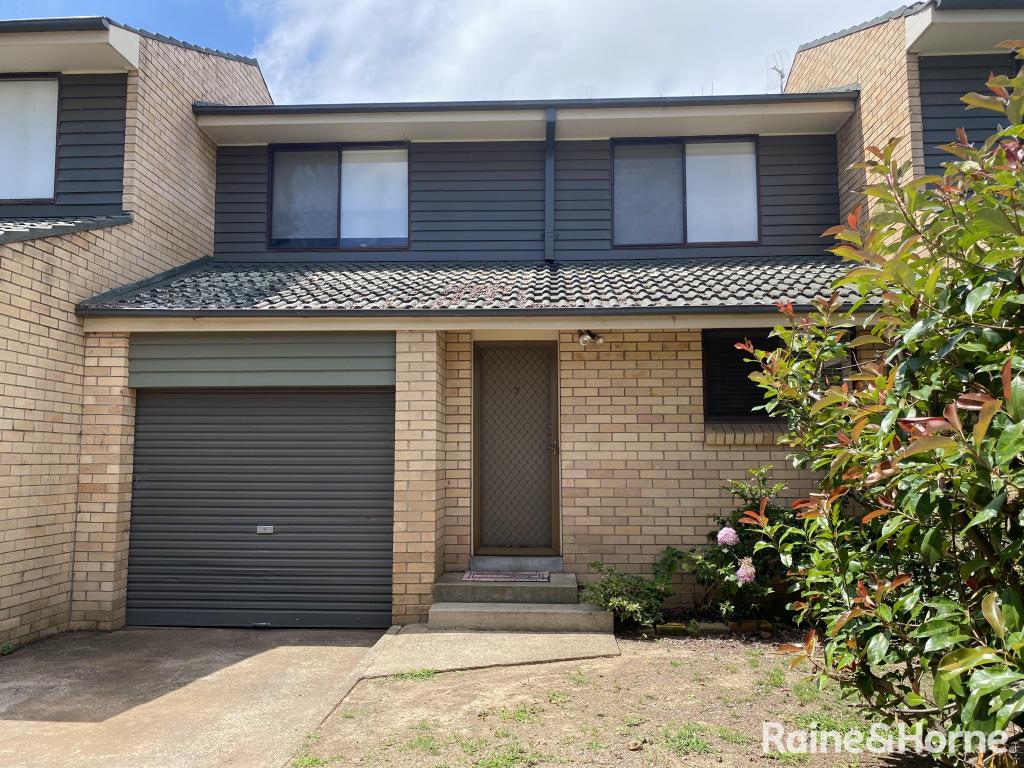 0
0About Orange 2800
The size of Orange is approximately 150.6 square kilometres. It has 98 parks covering nearly 4% of total area. The population of Orange in 2011 was 35,990 people. By 2016 the population was 38,093 showing a population growth of 5.8% in the area during that time. The predominant age group in Orange is 0-9 years. Households in Orange are primarily couples with children and are likely to be repaying $1400 - $1799 per month on mortgage repayments. In general, people in Orange work in a professional occupation. In 2011, 62.9% of the homes in Orange were owner-occupied compared with 61.8% in 2016.
Orange has 22,339 properties. Over the last 5 years, Houses in Orange have seen a 63.09% increase in median value, while Units have seen a 65.05% increase. As at 30 September 2024:
- The median value for Houses in Orange is $630,647 while the median value for Units is $418,308.
- Houses have a median rent of $540 while Units have a median rent of $440.
Suburb Insights for Orange 2800
Market Insights
Orange Trends for Houses
N/A
N/A
View TrendN/A
N/A
Orange Trends for Units
N/A
N/A
View TrendN/A
N/A
Neighbourhood Insights
© Copyright 2024 RP Data Pty Ltd trading as CoreLogic Asia Pacific (CoreLogic). All rights reserved.
This product uses cookies and other similar technologies to improve and customise your browsing experience, to tailor content and adverts, and for analytics and metrics regarding visitor usage on this product and other media. We may share cookie and analytics information with third parties for the purposes of advertising. By continuing to use our website, you consent to cookies being used. View our Privacy Policy here.
X