3/62 Havelock StreetMulwala NSW 2647
Property Details for 3/62 Havelock St, Mulwala
3/62 Havelock St, Mulwala is a 2 bedroom, 1 bathroom Unit with 1 parking spaces and was built in 1986. The property has a land size of 2023m2 and floor size of 97m2. While the property is not currently for sale or for rent, it was last sold in July 2020.
Last Listing description (July 2024)
This 2 bedroom furnished or unfurnished unit welcomes you with an open plan kitchen, dining, and living area fully serviced by reverse cycle heating, evaporative cooling plus ceiling fans ensuring comfort year-round. The two spacious bedrooms include built in robes and an abundance of natural light. Externally the unit includes a double carport, and low maintenance garden with a fully fenced back yard.
TO RENT THIS PROPERTY YOU MUST:
Fill in and submit to us a full application form complete with photo ID and proof of income for each adult applying.
For more information please call our team at Extons Real Estate 03-57431400
Property History for 3/62 Havelock St, Mulwala, NSW 2647
- 13 Jun 2024Listed for Rent $325 / week
- 07 Dec 2023Listed for Rent $350 / week
- 03 Oct 2023Listed for Sale Not Disclosed
Commute Calculator
Recent sales nearby
See more recent sales nearby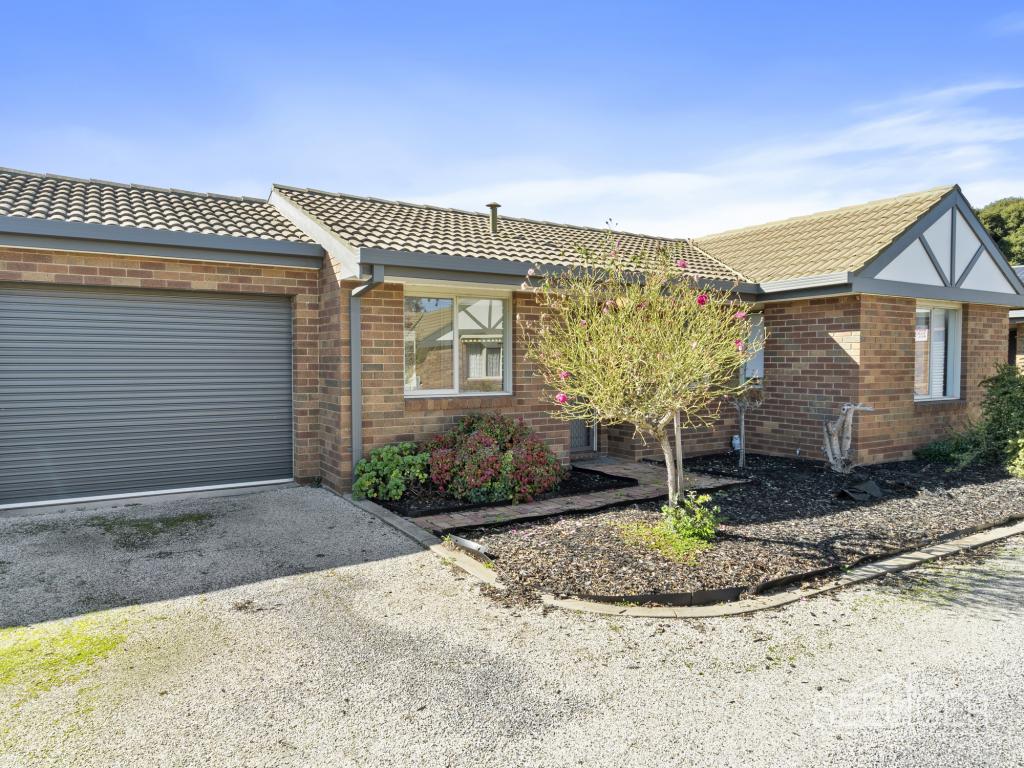 0
0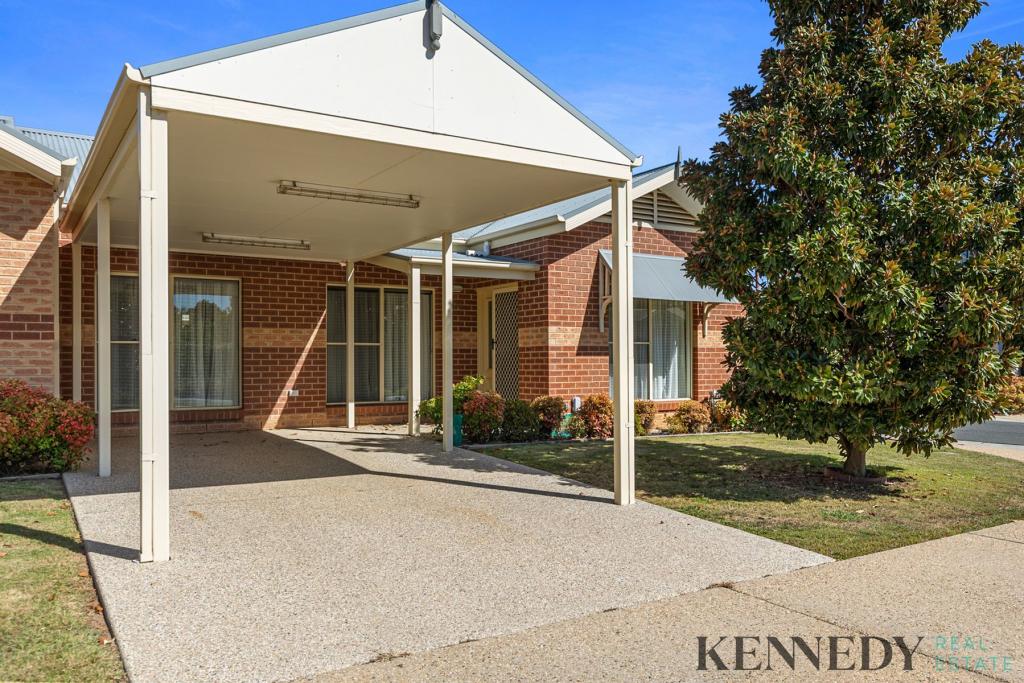 0
0Similar properties For Sale nearby
See more properties for sale nearby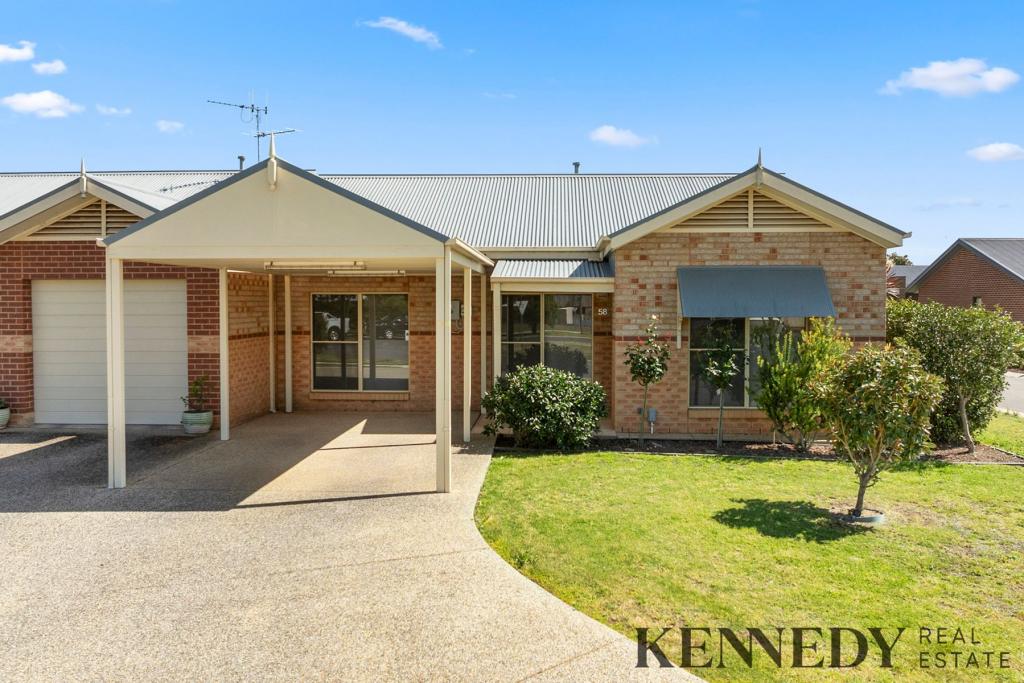 0
0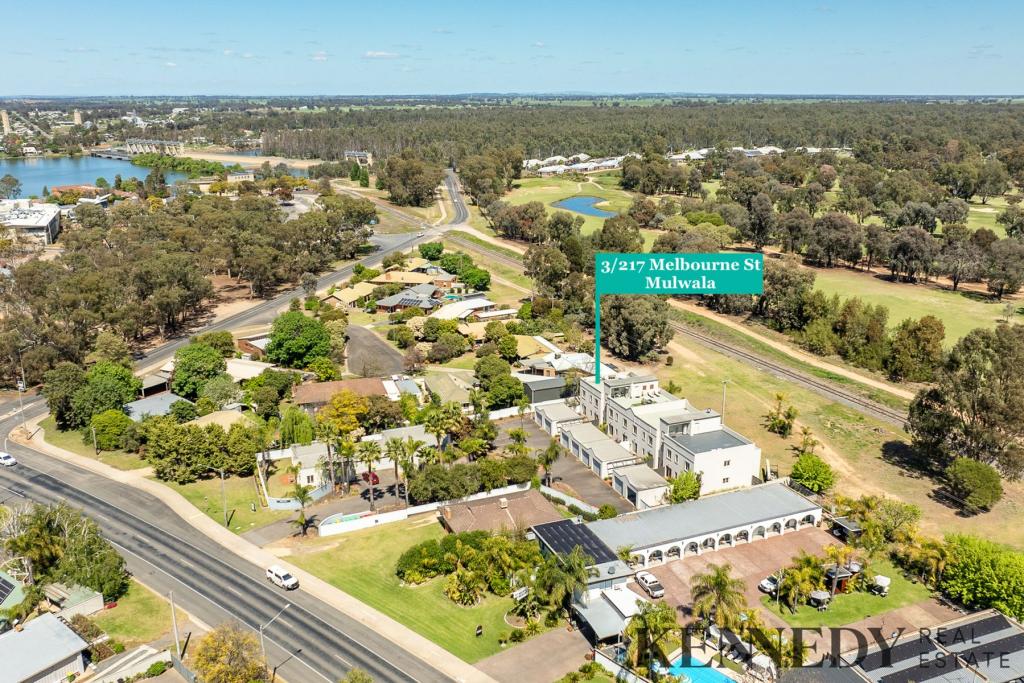 0
0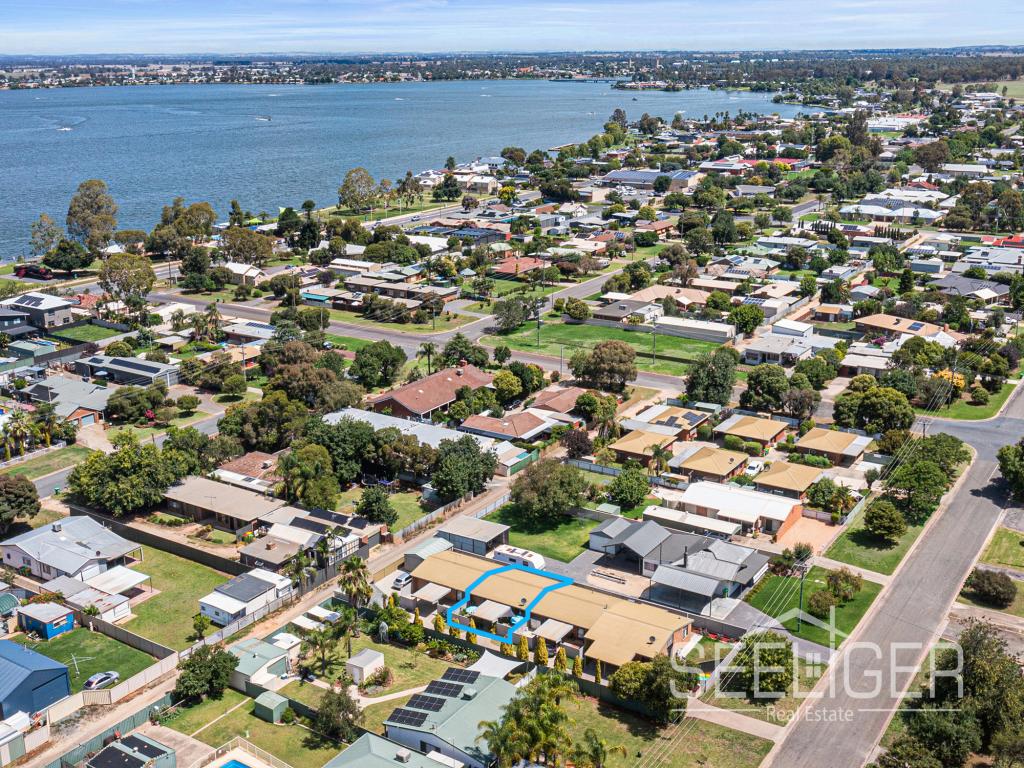 0
0Similar properties For Rent nearby
See more properties for rent nearby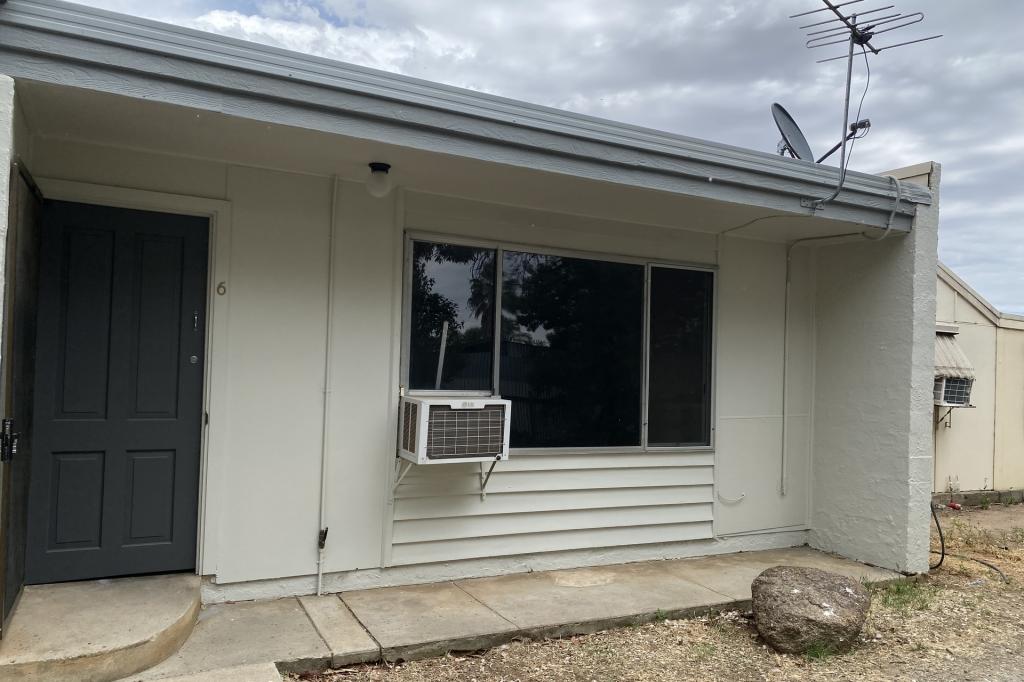 0
0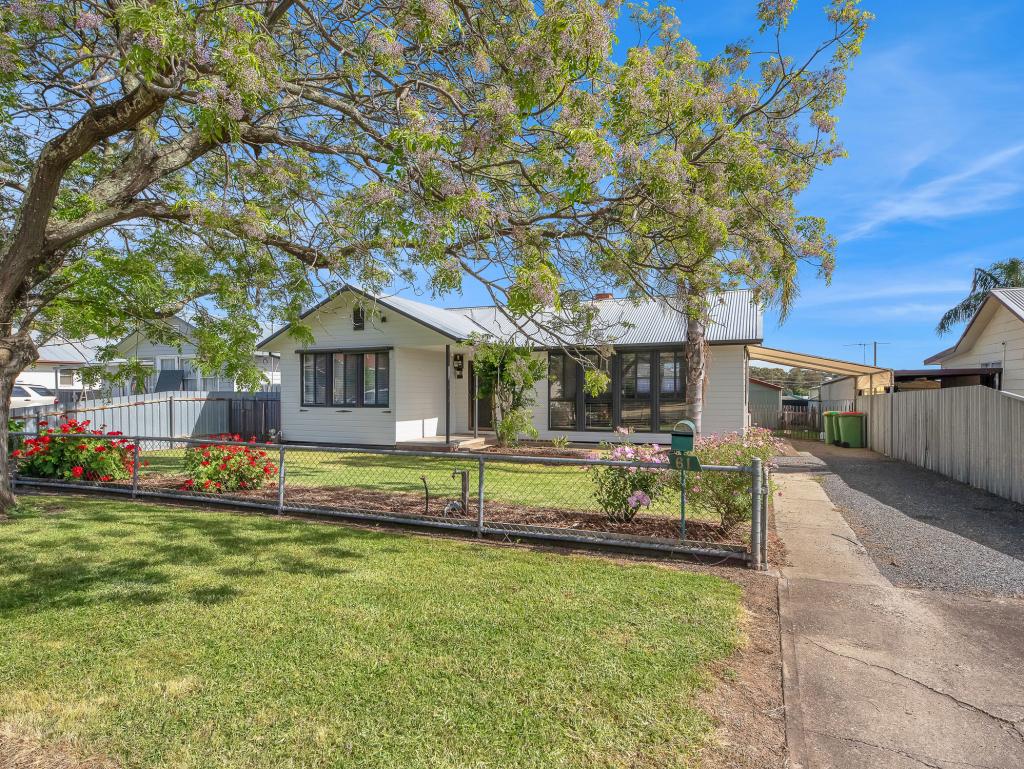 0
0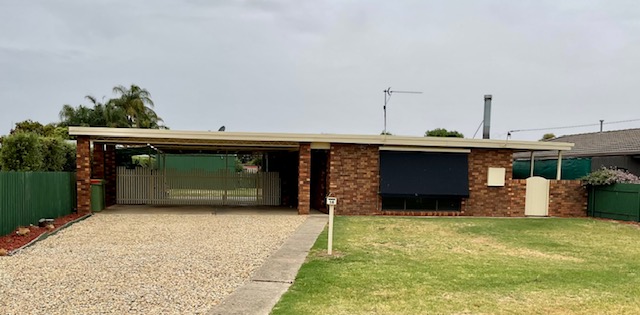 0
0About Mulwala 2647
The size of Mulwala is approximately 356.7 square kilometres. It has 15 parks covering nearly 4.3% of total area. The population of Mulwala in 2011 was 1,903 people. By 2016 the population was 2,173 showing a population growth of 14.2% in the area during that time. The predominant age group in Mulwala is 60-69 years. Households in Mulwala are primarily childless couples and are likely to be repaying $1000 - $1399 per month on mortgage repayments. In general, people in Mulwala work in a trades occupation. In 2011, 72.2% of the homes in Mulwala were owner-occupied compared with 72.6% in 2016.
Mulwala has 2,592 properties. Over the last 5 years, Houses in Mulwala have seen a 91.68% increase in median value, while Units have seen a 80.40% increase. As at 31 October 2024:
- The median value for Houses in Mulwala is $678,510 while the median value for Units is $437,484.
- Houses have a median rent of $450 while Units have a median rent of $355.
Suburb Insights for Mulwala 2647
Market Insights
Mulwala Trends for Houses
N/A
N/A
View TrendN/A
N/A
Mulwala Trends for Units
N/A
N/A
View TrendN/A
N/A
Neighbourhood Insights
© Copyright 2024 RP Data Pty Ltd trading as CoreLogic Asia Pacific (CoreLogic). All rights reserved.
This product uses cookies and other similar technologies to improve and customise your browsing experience, to tailor content and adverts, and for analytics and metrics regarding visitor usage on this product and other media. We may share cookie and analytics information with third parties for the purposes of advertising. By continuing to use our website, you consent to cookies being used. View our Privacy Policy here.
X