43 Edward StreetMolong NSW 2866
Property Details for 43 Edward St, Molong
43 Edward St, Molong is a 3 bedroom, 1 bathroom House and was built in 1920. The property has a land size of 483m2 and floor size of 147m2. While the property is not currently for sale or for rent, it was last sold in November 2020.
Last Listing description (January 2023)
There is a lot of history in the property and now it's ready for its next chapter. Yes, there is a lot of work that needs to be done but the bones are there and with some planning and hard work the result could be amazing. Some original features remain including pressed tin and timber panelled ceilings, fireplaces with mantles and even the wood stove in the kitchen which were once a mainstay in homes like these. The current floor plan has a formal lounge and three big bedrooms. There is a dining/living space off the kitchen plus bathroom, separate toilet and a laundry. Being already stripped back to its bare bones means you could take the opportunity to change the floorplan or extend out into the backyard. On a good sized block and just a short walk to the Molong shops and cafes it sits in a great location in this lovely country town.
Property History for 43 Edward St, Molong, NSW 2866
- 16 Nov 2022Listed for Sale $299,000
- 25 Nov 2020Sold for $149,000
- 10 Nov 2020Listed for Sale $149,000
Commute Calculator
Recent sales nearby
See more recent sales nearby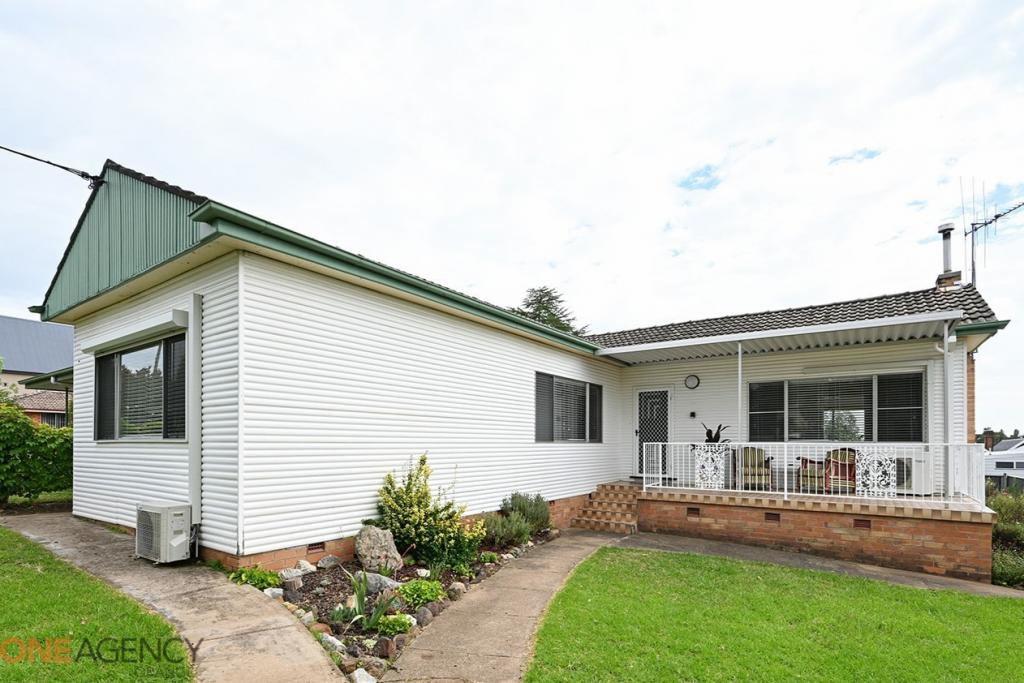 0
0Similar properties For Sale nearby
See more properties for sale nearby 0
0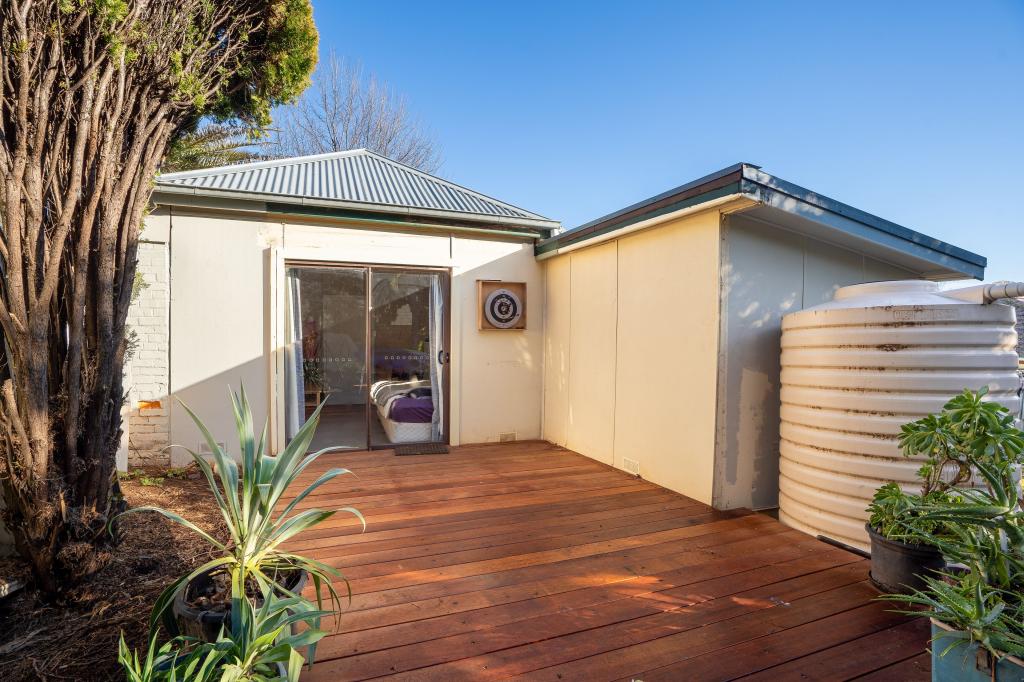 0
0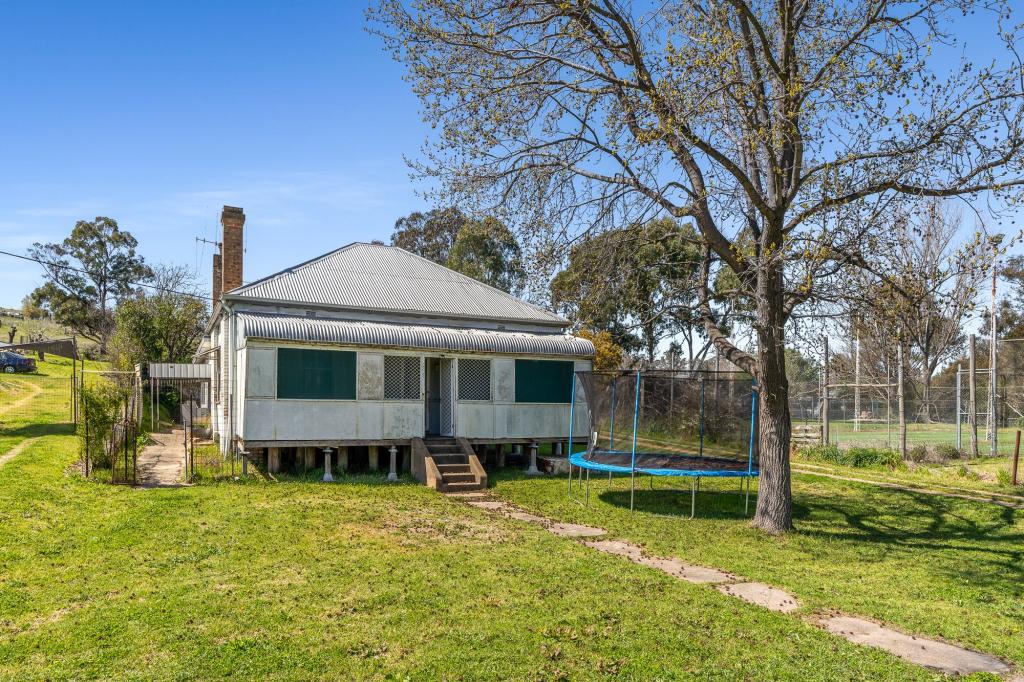 0
0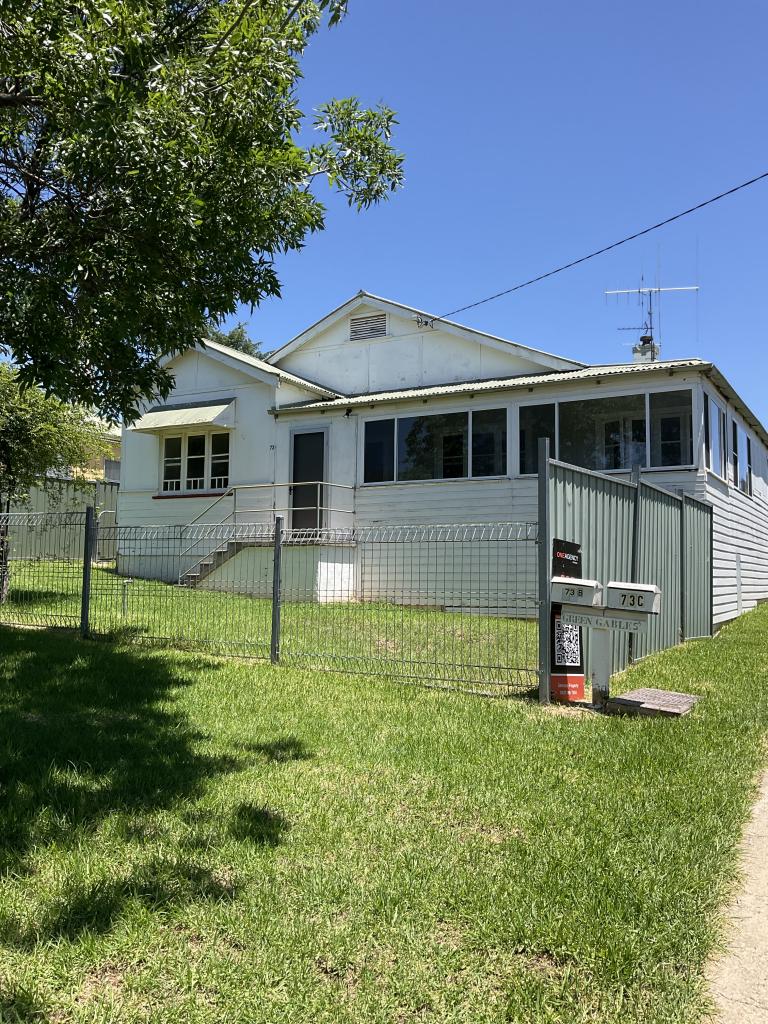 0
0About Molong 2866
The size of Molong is approximately 425.3 square kilometres. It has 2 parks. The population of Molong in 2011 was 2,515 people. By 2016 the population was 2,594 showing a population growth of 3.1% in the area during that time. The predominant age group in Molong is 10-19 years. Households in Molong are primarily couples with children and are likely to be repaying $1000 - $1399 per month on mortgage repayments. In general, people in Molong work in a managers occupation. In 2011, 74.1% of the homes in Molong were owner-occupied compared with 71.2% in 2016.
Molong has 1,496 properties. Over the last 5 years, Houses in Molong have seen a 94.35% increase in median value, while Units have seen a 38.18% increase. As at 30 November 2024:
- The median value for Houses in Molong is $507,383 while the median value for Units is $434,580.
- Houses have a median rent of $450.
Suburb Insights for Molong 2866
Market Insights
Molong Trends for Houses
N/A
N/A
View TrendN/A
N/A
Molong Trends for Units
N/A
N/A
View TrendN/A
N/A
Neighbourhood Insights
© Copyright 2024 RP Data Pty Ltd trading as CoreLogic Asia Pacific (CoreLogic). All rights reserved.
This product uses cookies and other similar technologies to improve and customise your browsing experience, to tailor content and adverts, and for analytics and metrics regarding visitor usage on this product and other media. We may share cookie and analytics information with third parties for the purposes of advertising. By continuing to use our website, you consent to cookies being used. View our Privacy Policy here.
X