31 Smith StreetMolong NSW 2866
Property Details for 31 Smith St, Molong
31 Smith St, Molong is a 4 bedroom, 1 bathroom House and was built in 1970. The property has a land size of 639m2 and floor size of 121m2. While the property is not currently for sale or for rent, it was last sold in September 2020.
Last Listing description (October 2020)
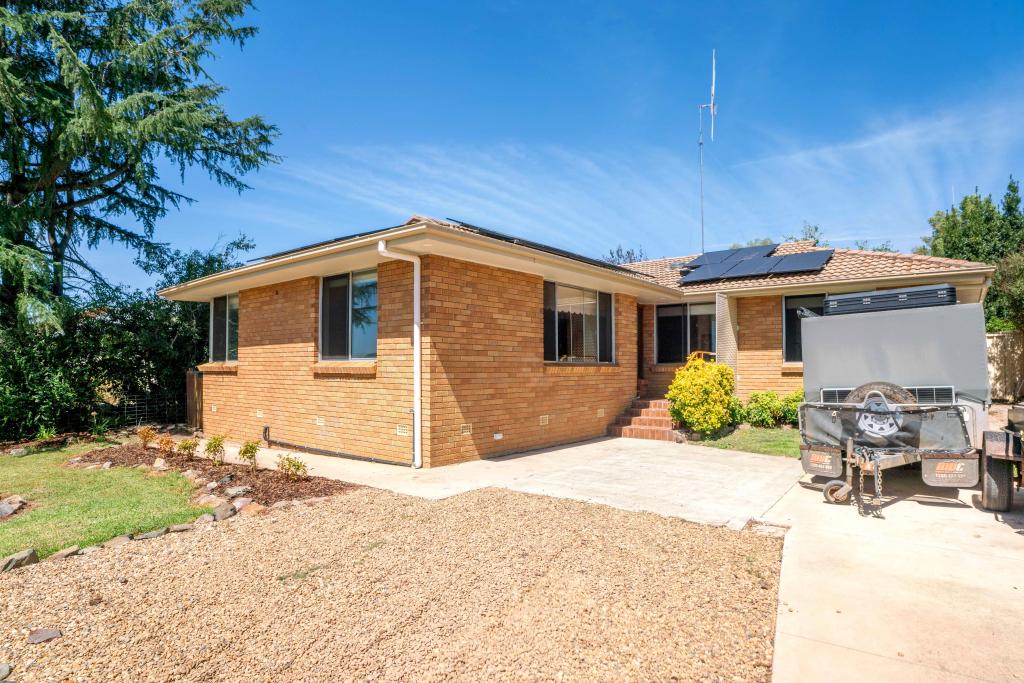
The hard work has been done here. Recently renovated the home feels bright and fresh and it will be hard to find better value for money. Situated in a desirable and convenient location this property will be appealing to families and also very attractive to investors with an estimated rental yield exceeding 6%. There are 4 bedrooms in total and the main bedroom is generously sized and features a huge walk in robe. Your year round comfort is assured with wood heating and a reverse cycle split system air conditioner and there is a handy second toilet in the laundry. Outside there is a large covered, north facing entertaining area as well a fully lined studio that would make a great man cave or teenager retreat.
Property History for 31 Smith St, Molong, NSW 2866
- 11 Sep 2020Sold for $290,000
- 24 May 2019Listed for Sale $279,000
- 31 Oct 2017Sold for $240,000
Commute Calculator
Recent sales nearby
See more recent sales nearby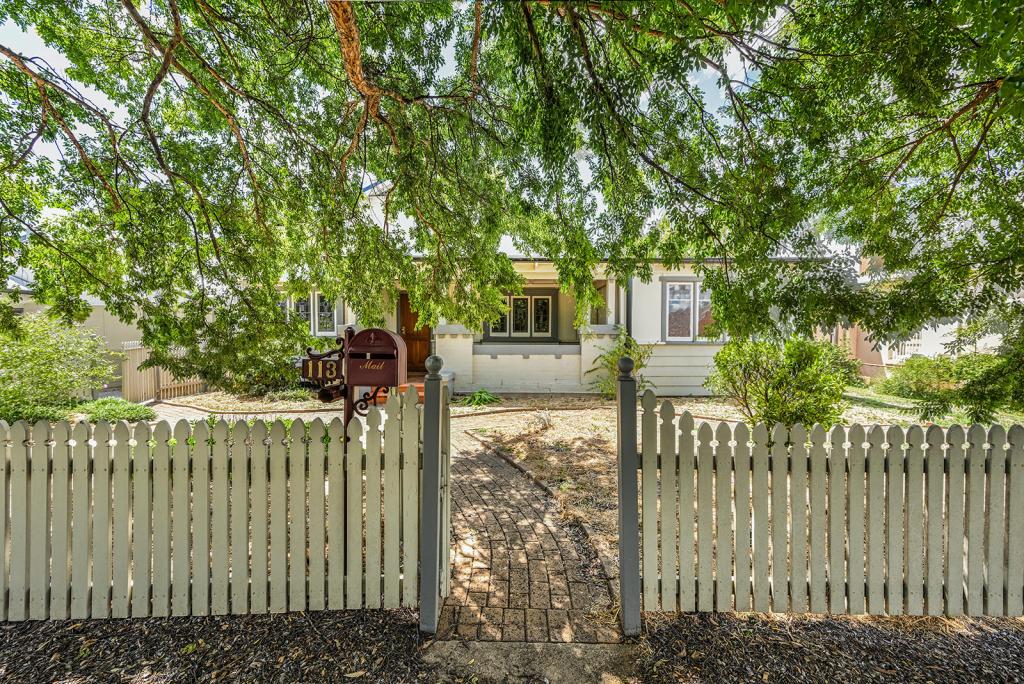 0
0
Similar properties For Sale nearby
See more properties for sale nearby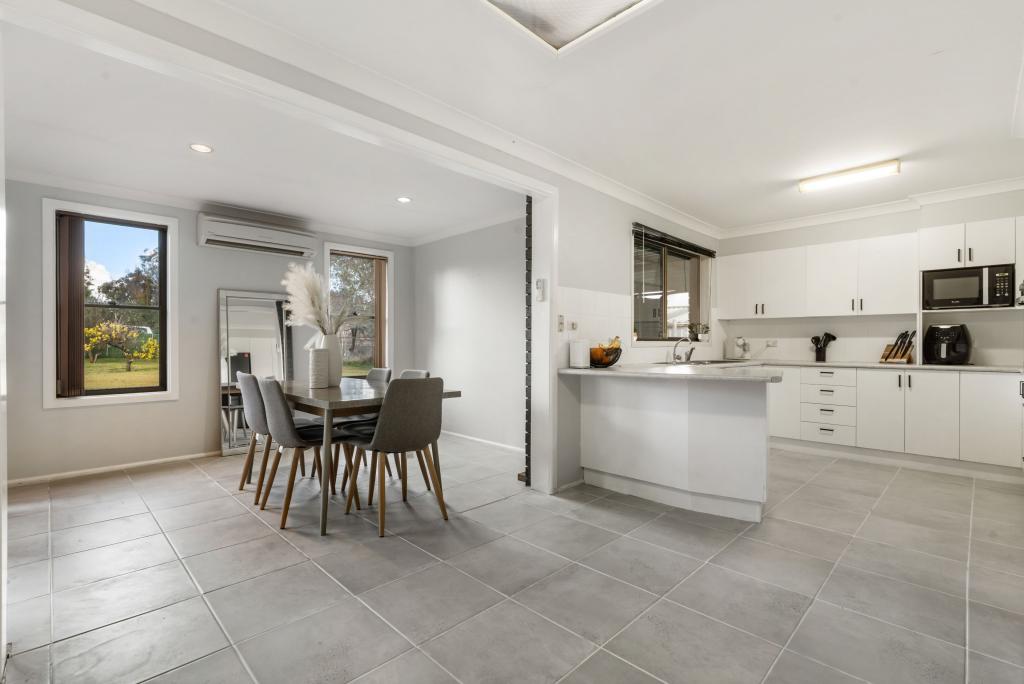 0
0
 0
0 0
0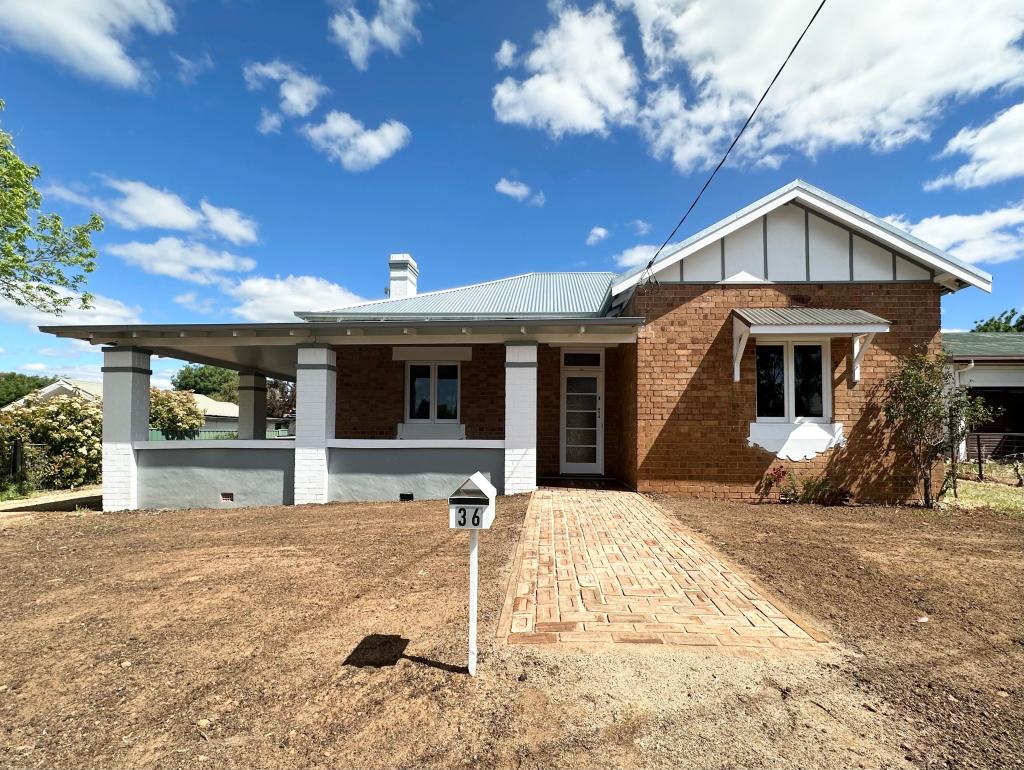 0
0About Molong 2866
The size of Molong is approximately 425.3 square kilometres. It has 2 parks. The population of Molong in 2011 was 2,515 people. By 2016 the population was 2,594 showing a population growth of 3.1% in the area during that time. The predominant age group in Molong is 10-19 years. Households in Molong are primarily couples with children and are likely to be repaying $1000 - $1399 per month on mortgage repayments. In general, people in Molong work in a managers occupation. In 2011, 74.1% of the homes in Molong were owner-occupied compared with 71.2% in 2016.
Molong has 1,488 properties. Over the last 5 years, Houses in Molong have seen a 77.36% increase in median value, while Units have seen a 73.33% increase. As at 31 August 2024:
- The median value for Houses in Molong is $498,615 while the median value for Units is $480,683.
- Houses have a median rent of $415.
Suburb Insights for Molong 2866
Market Insights
Molong Trends for Houses
N/A
N/A
View TrendN/A
N/A
Molong Trends for Units
N/A
N/A
View TrendN/A
N/A
Neighbourhood Insights
© Copyright 2024 RP Data Pty Ltd trading as CoreLogic Asia Pacific (CoreLogic). All rights reserved.
This product uses cookies and other similar technologies to improve and customise your browsing experience, to tailor content and adverts, and for analytics and metrics regarding visitor usage on this product and other media. We may share cookie and analytics information with third parties for the purposes of advertising. By continuing to use our website, you consent to cookies being used. View our Privacy Policy here.
X