13 Molong StreetMolong NSW 2866
Property Details for 13 Molong St, Molong
13 Molong St, Molong is a 3 bedroom, 1 bathroom House with 1 parking spaces and was built in 1950. The property has a land size of 1008m2 and floor size of 103m2. While the property is not currently for sale or for rent, it was last sold in December 2021.
Last Listing description (February 2022)
This quaint cottage features three bedrooms, or two bedrooms with home office and study. The two main bedrooms have built-in robes and ceiling fans. Lounge room is large with wood fireplace and reverse cycle air conditioning. Good sized dining and kitchen has electric appliances, dishwasher, ample cupboards and island bench. The home is light filled, has high ceilings and neutral colour palette. The large back yard is attractive with well established trees and greenery and a single lock up garage. Inspection by appointment. Sorry, no pets.
Property History for 13 Molong St, Molong, NSW 2866
- 02 Feb 2022Listed for Rent $350 / week
- 09 Dec 2021Sold for $430,000
- 28 Mar 2019Sold for $267,000
Commute Calculator
Similar properties For Sale nearby
See more properties for sale nearby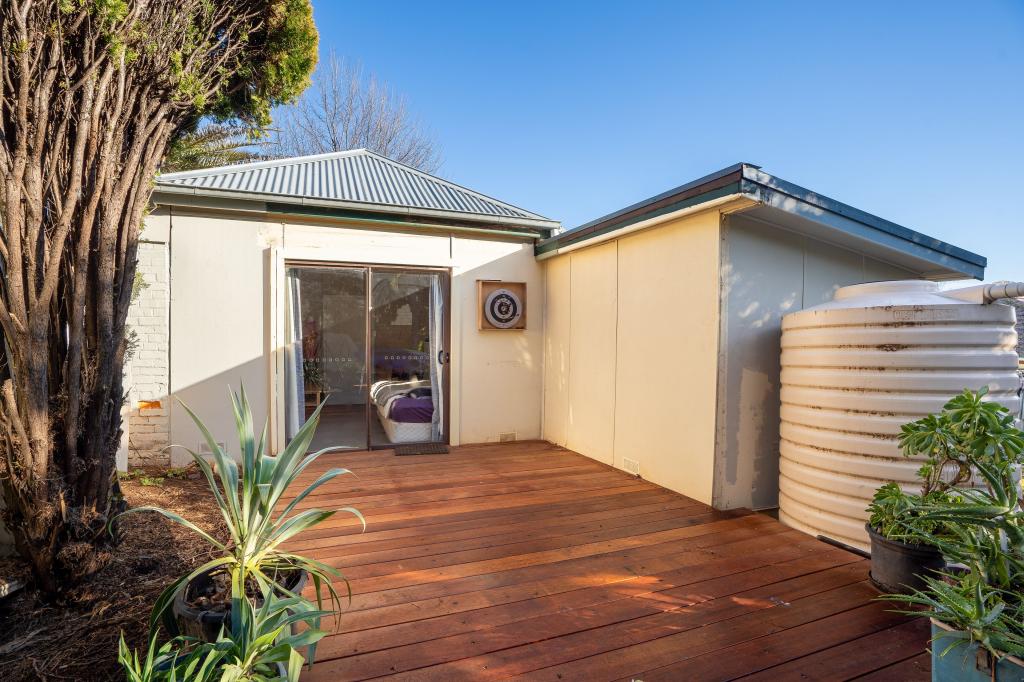 0
0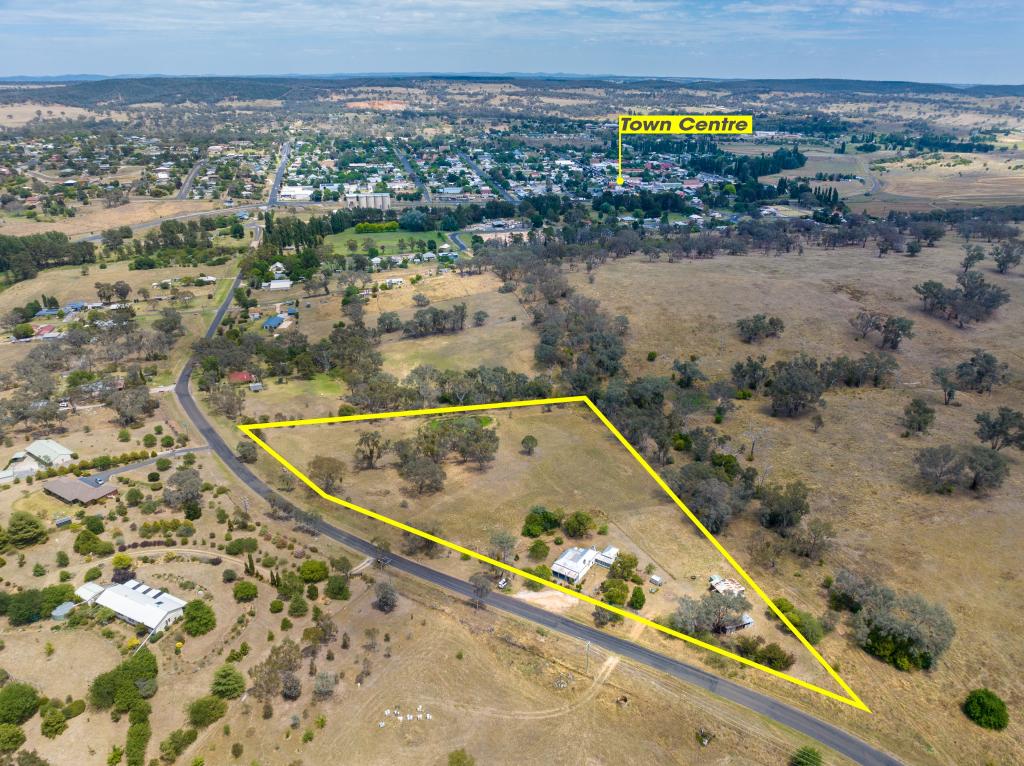 0
0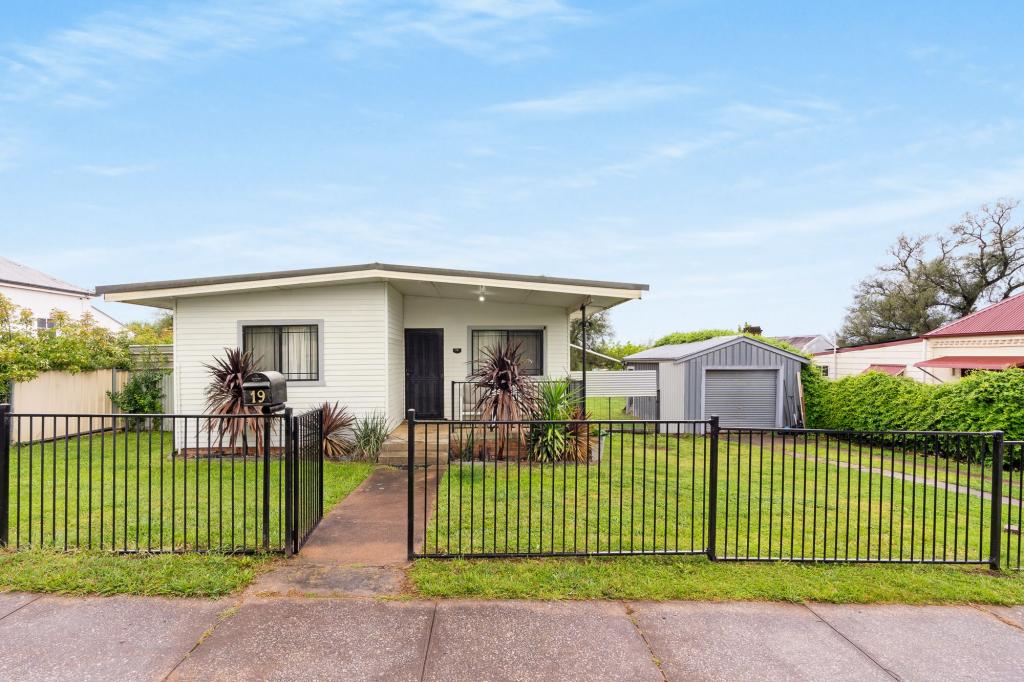 0
0Similar properties For Rent nearby
See more properties for rent nearby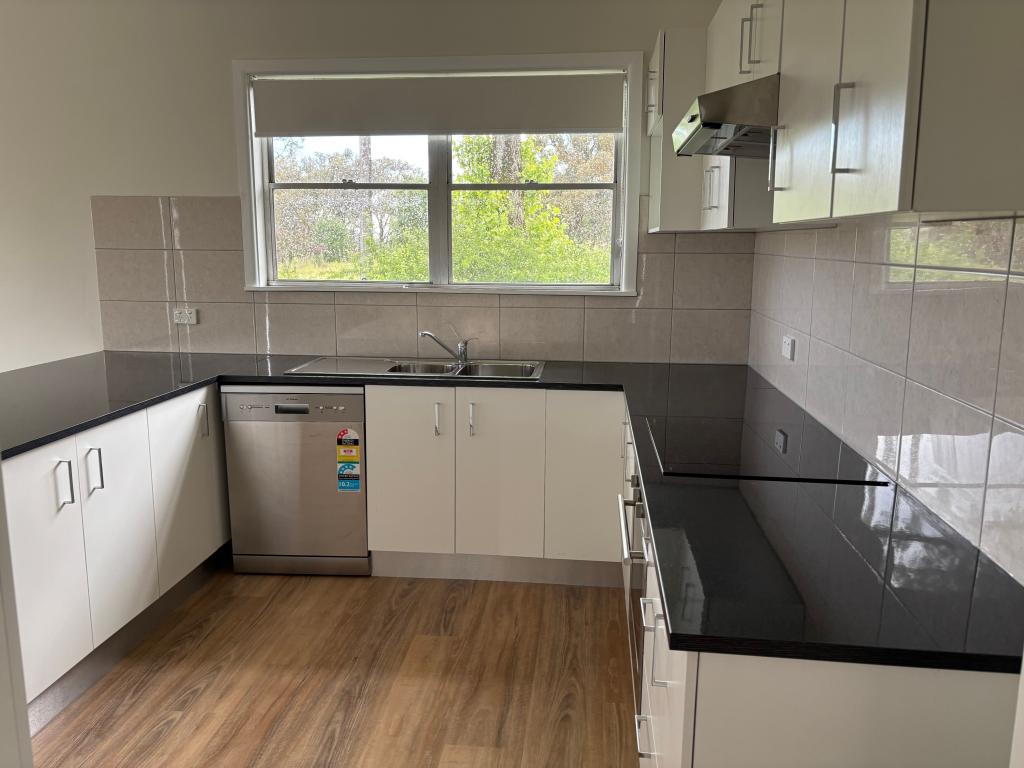 0
0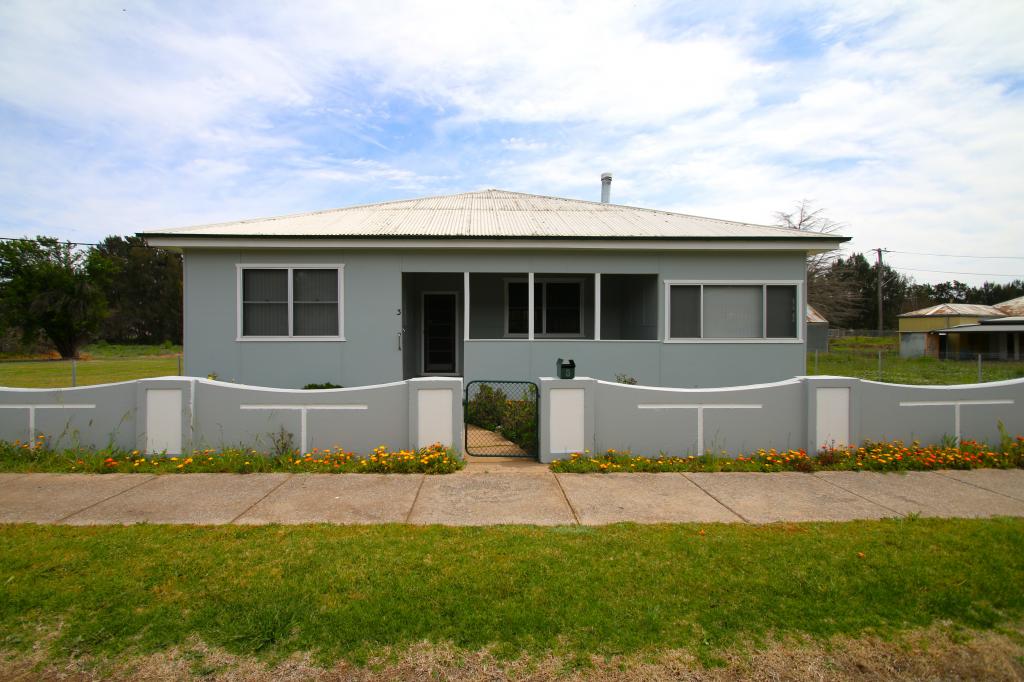 0
0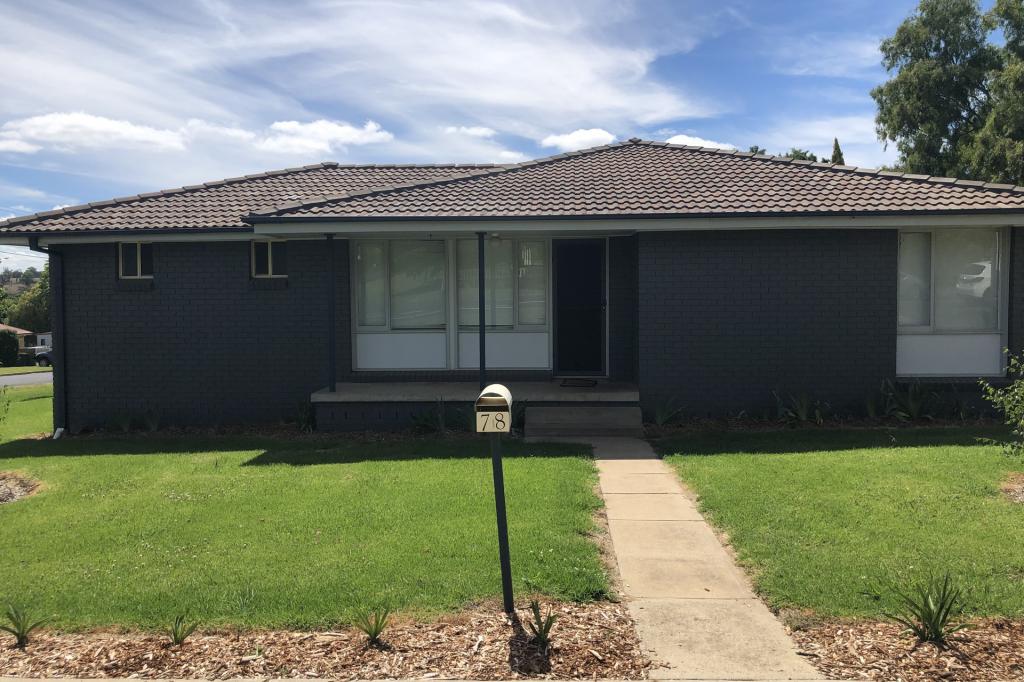 0
0Suburb Insights for Molong 2866
Market Insights
Molong Trends for Houses
N/A
N/A
View TrendN/A
N/A
Molong Trends for Units
N/A
N/A
View TrendN/A
N/A
Neighbourhood Insights
© Copyright 2024 RP Data Pty Ltd trading as CoreLogic Asia Pacific (CoreLogic). All rights reserved.
This product uses cookies and other similar technologies to improve and customise your browsing experience, to tailor content and adverts, and for analytics and metrics regarding visitor usage on this product and other media. We may share cookie and analytics information with third parties for the purposes of advertising. By continuing to use our website, you consent to cookies being used. View our Privacy Policy here.
X