11 Edward StreetMolong NSW 2866
Property Details for 11 Edward St, Molong
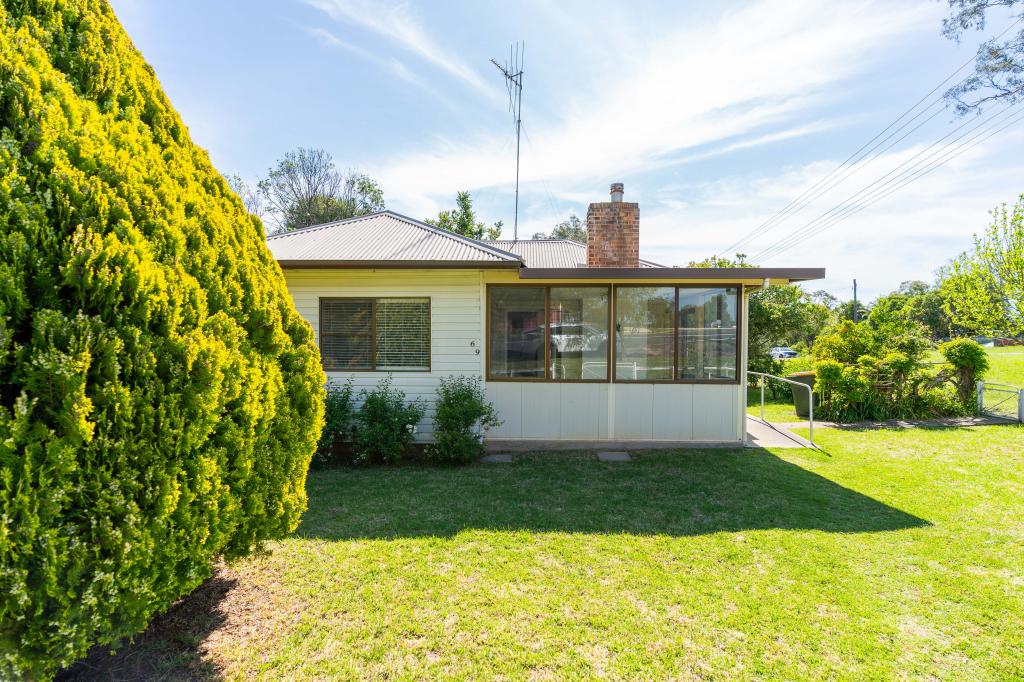
11 Edward St, Molong is a 2 bedroom, 1 bathroom House and was built in 1940. The property has a land size of 835m2 and floor size of 108m2. While the property is not currently for sale or for rent, it was last sold in January 2022.
Last Listing description (March 2022)
This property is all about the location and the potential it offers. It is a very easy walk to the charming Molong town centre and there is a lovely outlook across the road to the park. The good sized block of 835 sqm would be perfect for a new build or the addition of units or townhouses (subject to Council approval) capitalising on the great location. There is good access to the corner block both from the front and down the laneway beside. There really is a lot of opportunity here to make the most of what's on offer. The existing building has been vacant for many years and the property is well and truly ready for a new lease on life.
Property History for 11 Edward St, Molong, NSW 2866
- 19 Jan 2022Sold for $210,000
- 28 Sep 2021Listed for Sale $225,000
- 17 Jun 2002Sold for $38,000
Commute Calculator
Recent sales nearby
See more recent sales nearbySimilar properties For Sale nearby
See more properties for sale nearby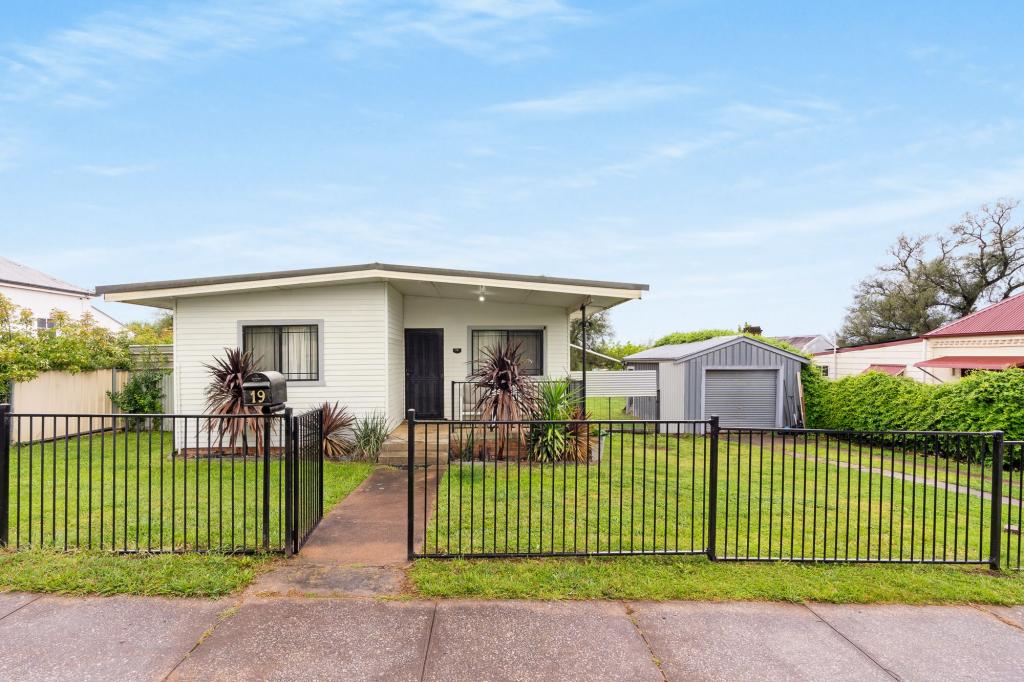 0
0
 0
0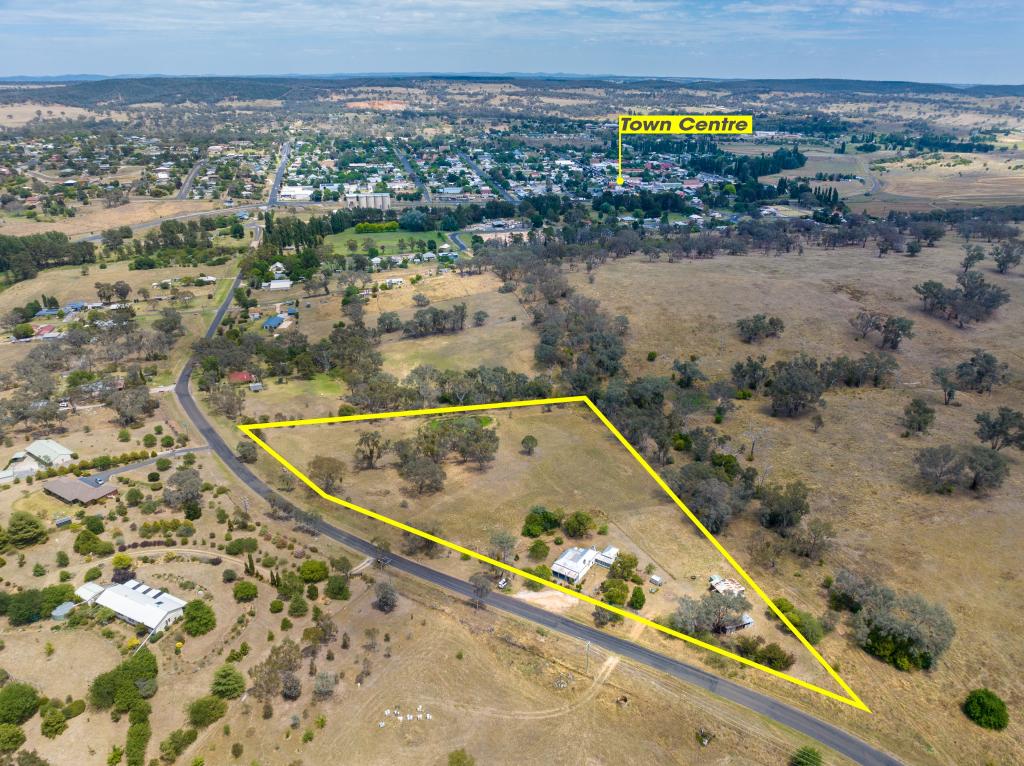 0
0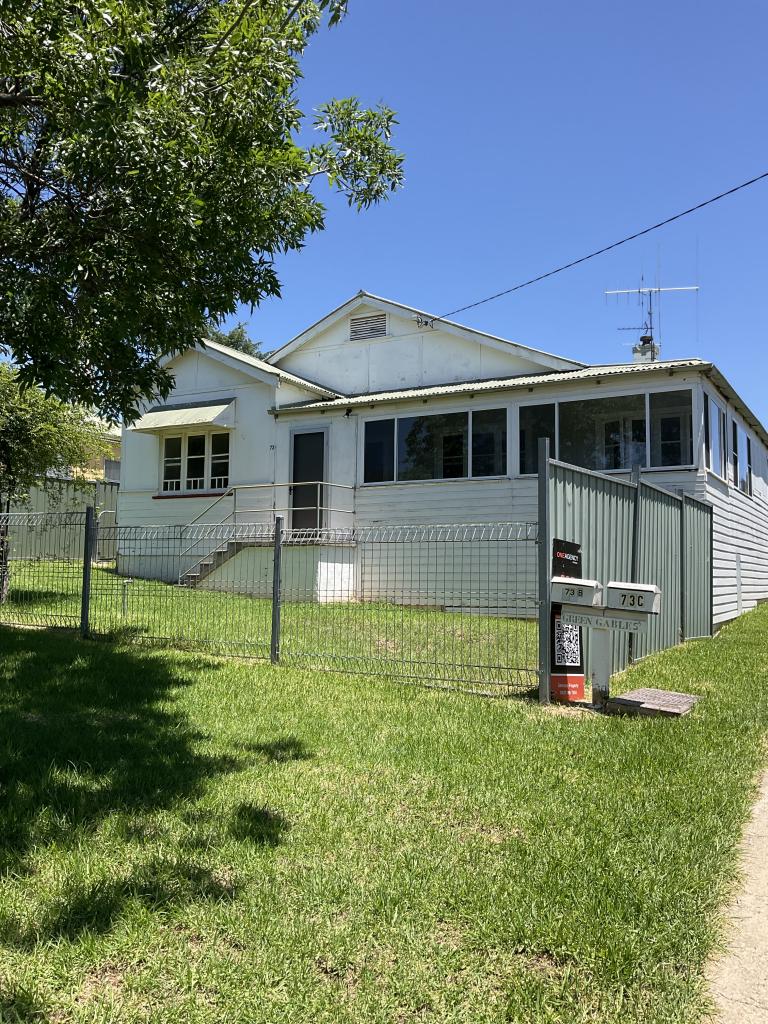 0
0About Molong 2866
The size of Molong is approximately 425.3 square kilometres. It has 2 parks. The population of Molong in 2011 was 2,515 people. By 2016 the population was 2,594 showing a population growth of 3.1% in the area during that time. The predominant age group in Molong is 10-19 years. Households in Molong are primarily couples with children and are likely to be repaying $1000 - $1399 per month on mortgage repayments. In general, people in Molong work in a managers occupation. In 2011, 74.1% of the homes in Molong were owner-occupied compared with 71.2% in 2016.
Molong has 1,496 properties. Over the last 5 years, Houses in Molong have seen a 94.35% increase in median value, while Units have seen a 38.18% increase. As at 30 November 2024:
- The median value for Houses in Molong is $507,383 while the median value for Units is $434,580.
- Houses have a median rent of $450.
Suburb Insights for Molong 2866
Market Insights
Molong Trends for Houses
N/A
N/A
View TrendN/A
N/A
Molong Trends for Units
N/A
N/A
View TrendN/A
N/A
Neighbourhood Insights
© Copyright 2024 RP Data Pty Ltd trading as CoreLogic Asia Pacific (CoreLogic). All rights reserved.
This product uses cookies and other similar technologies to improve and customise your browsing experience, to tailor content and adverts, and for analytics and metrics regarding visitor usage on this product and other media. We may share cookie and analytics information with third parties for the purposes of advertising. By continuing to use our website, you consent to cookies being used. View our Privacy Policy here.
X