23 Carroll AvenueMollymook Beach NSW 2539
Property Details for 23 Carroll Ave, Mollymook Beach
23 Carroll Ave, Mollymook Beach is a 3 bedroom, 2 bathroom House with 1 parking spaces and was built in 1975. The property has a land size of 708m2 and floor size of 130m2. While the property is not currently for sale or for rent, it was last sold in July 2019.
Last Listing description (July 2020)
This perfectly situated home is close to Mollymook shops, football oval and beach. There are three bedrooms, a main bathroom, with open plan kitchen, dining, and lounge. There is an enclosed sunroom positioned at the front of the property and behind the home is a covered sleep-out complete with ensuite. The yard is fully fenced and there is a Single lock up garage beneath the home with plenty of under-house storage.
Pets are considered upon application.
Property History for 23 Carroll Ave, Mollymook Beach, NSW 2539
- 13 Jul 2020Listed for Rent $380 / week
- 10 Jul 2019Sold for $535,000
- 03 Apr 2019Listed for Sale $549,000
Commute Calculator
Recent sales nearby
See more recent sales nearby 0
0
 0
0 0
0Similar properties For Sale nearby
See more properties for sale nearby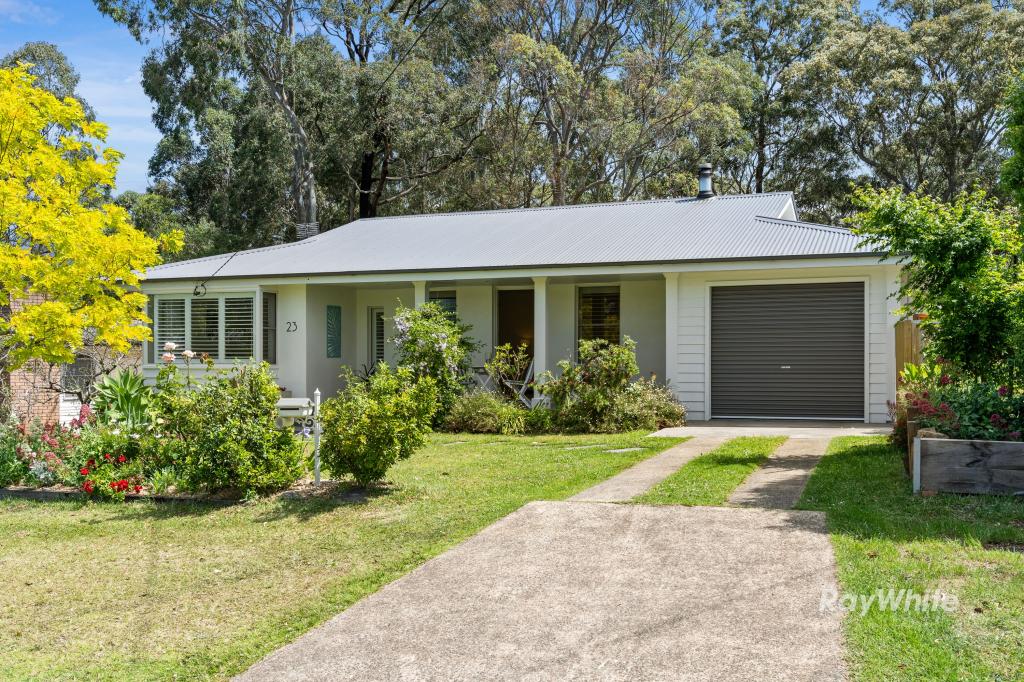 0
0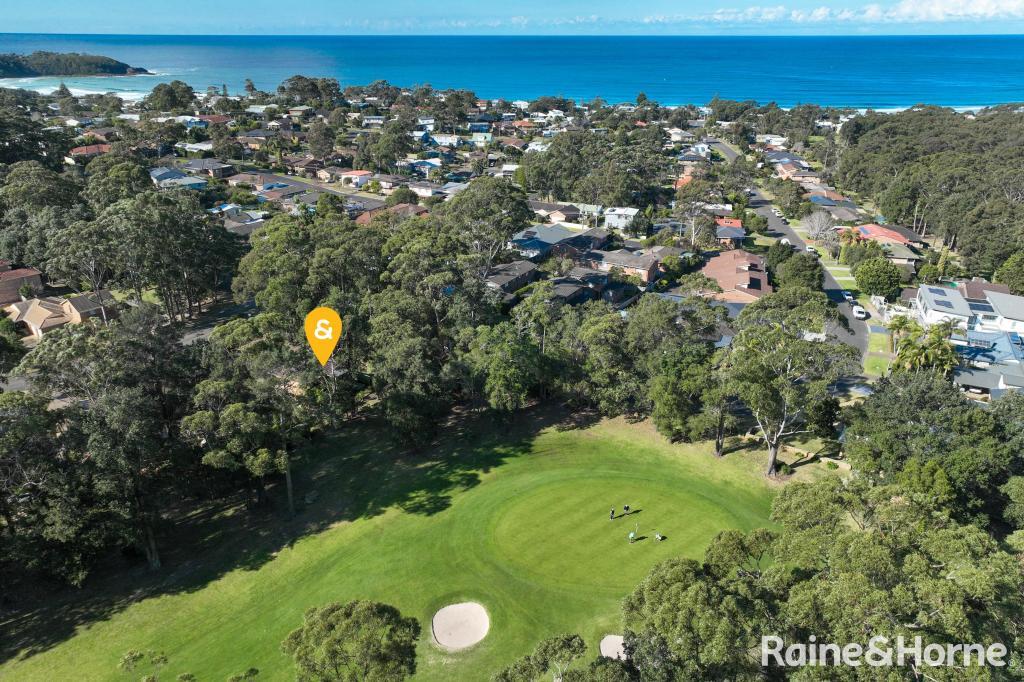 0
0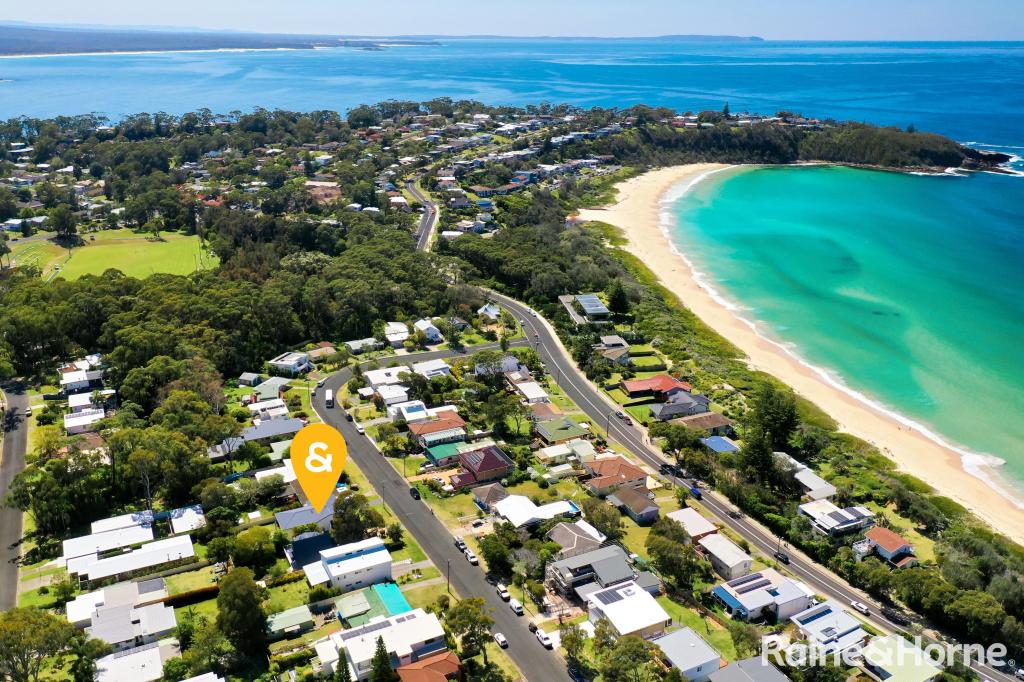 0
0Similar properties For Rent nearby
See more properties for rent nearby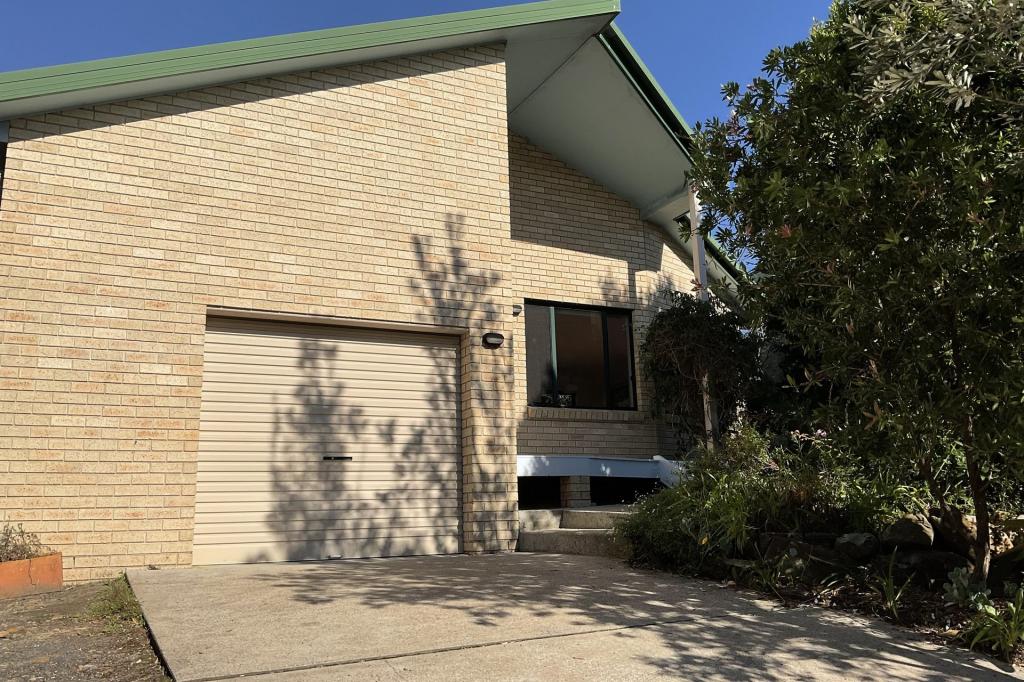 0
0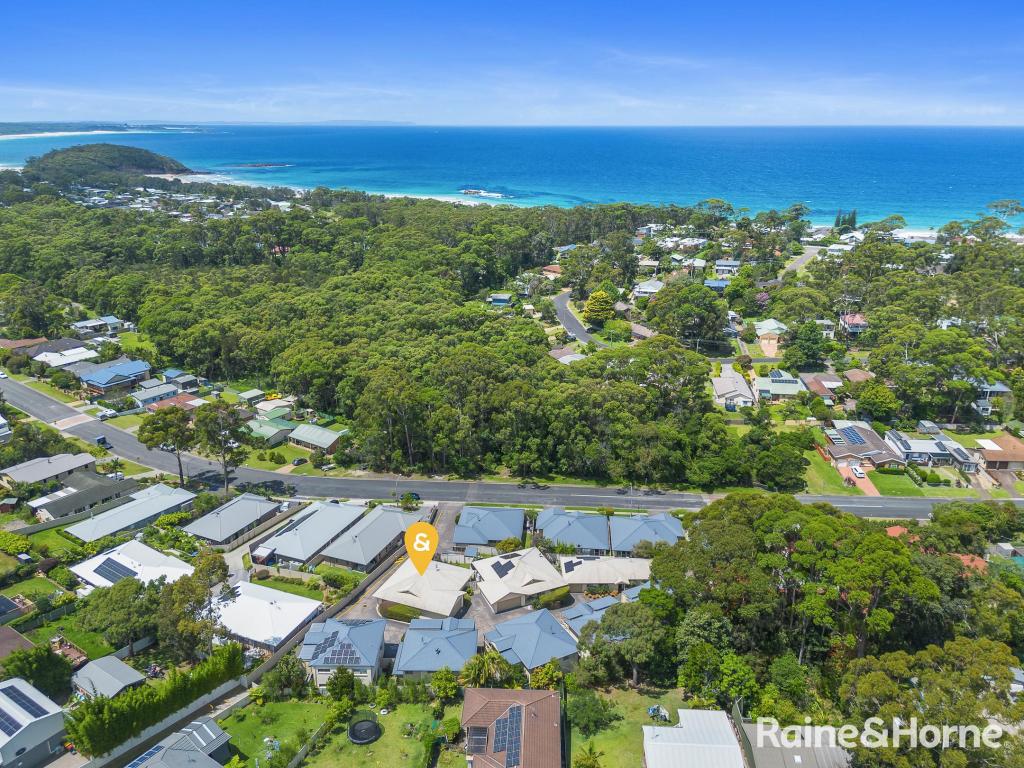 0
0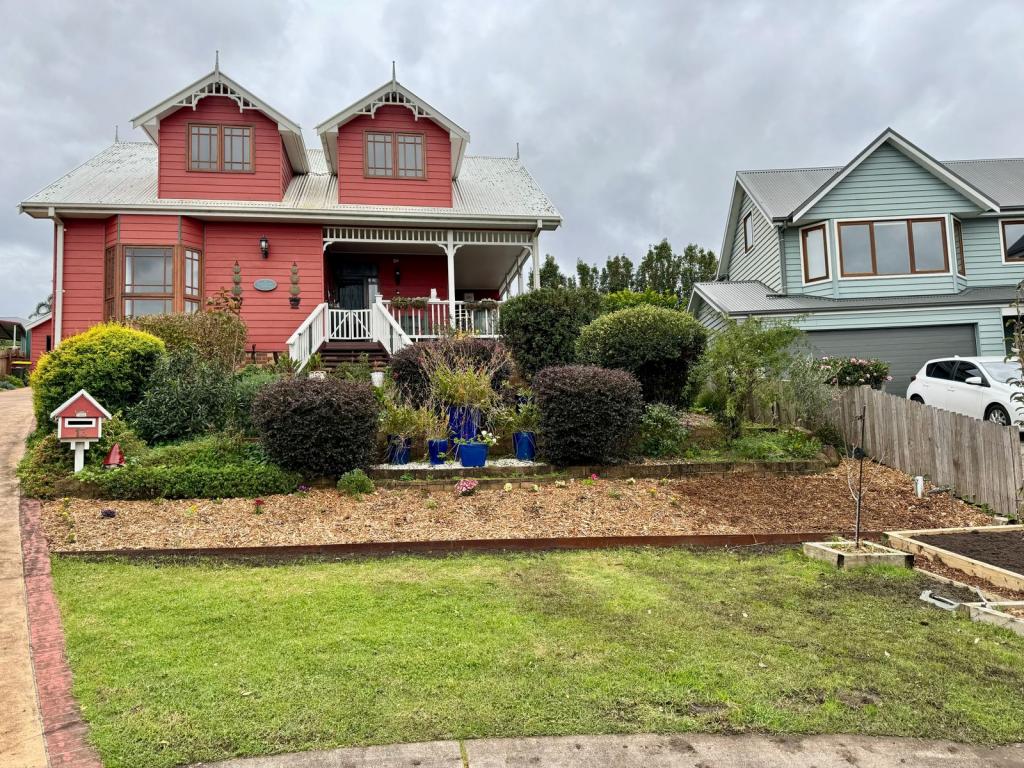 0
0
About Mollymook Beach 2539
The size of Mollymook Beach is approximately 3.3 square kilometres. It has 12 parks covering nearly 34.3% of total area. The population of Mollymook Beach in 2011 was 2,060 people. By 2016 the population was 2,446 showing a population growth of 18.7% in the area during that time. The predominant age group in Mollymook Beach is 60-69 years. Households in Mollymook Beach are primarily childless couples and are likely to be repaying $1800 - $2399 per month on mortgage repayments. In general, people in Mollymook Beach work in a professional occupation. In 2011, 72.8% of the homes in Mollymook Beach were owner-occupied compared with 77.3% in 2016.
Mollymook Beach has 1,977 properties. Over the last 5 years, Houses in Mollymook Beach have seen a 86.22% increase in median value, while Units have seen a 56.62% increase. As at 31 October 2024:
- The median value for Houses in Mollymook Beach is $1,077,561 while the median value for Units is $679,332.
- Houses have a median rent of $580 while Units have a median rent of $500.
Suburb Insights for Mollymook Beach 2539
Market Insights
Mollymook Beach Trends for Houses
N/A
N/A
View TrendN/A
N/A
Mollymook Beach Trends for Units
N/A
N/A
View TrendN/A
N/A
Neighbourhood Insights
© Copyright 2024 RP Data Pty Ltd trading as CoreLogic Asia Pacific (CoreLogic). All rights reserved.
This product uses cookies and other similar technologies to improve and customise your browsing experience, to tailor content and adverts, and for analytics and metrics regarding visitor usage on this product and other media. We may share cookie and analytics information with third parties for the purposes of advertising. By continuing to use our website, you consent to cookies being used. View our Privacy Policy here.
X