126 Mitchell ParadeMollymook Beach NSW 2539
Property Details for 126 Mitchell Pde, Mollymook Beach
126 Mitchell Pde, Mollymook Beach is a 3 bedroom, 1 bathroom House with 2 parking spaces and was built in 2018. The property has a land size of 591m2 and floor size of 290m2. While the property is not currently for sale or for rent, it was last sold in May 2013.
Last Listing description (May 2013)
Don't miss this under capitalised landholding from a by-gone era. This beachside cottage has 180 degree panoramic views of magnificent Mollymook Beach.
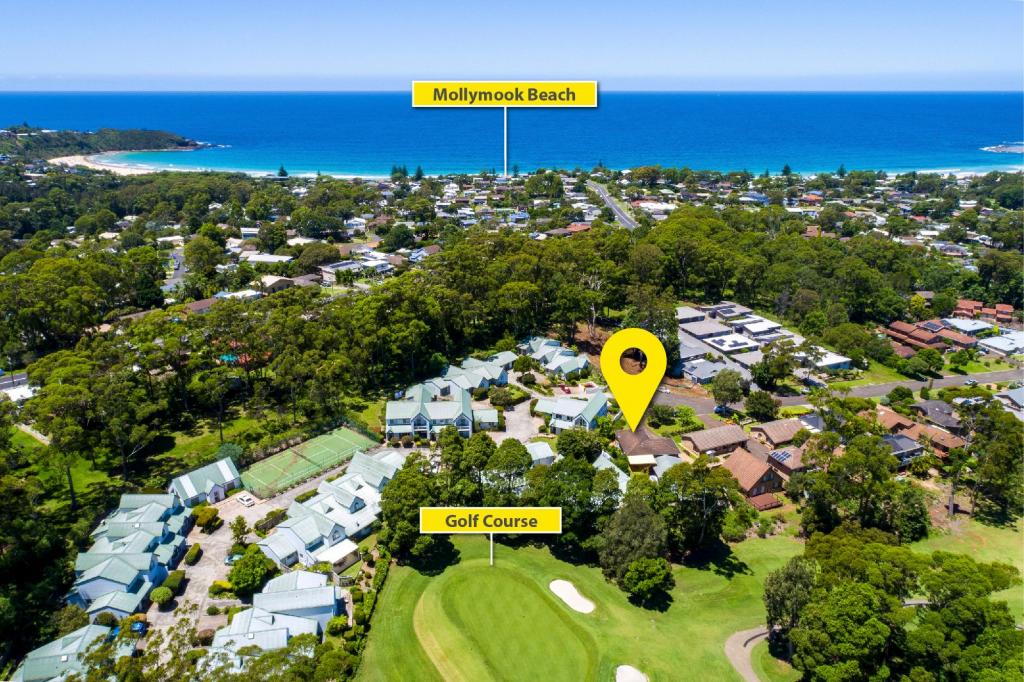
Enjoy as a retro beach pad or make the most of this opportunity to build your dream home. Watch the whales and dolphins play from your P&O style rear verandah whilst being a lazy walk to the golden sands of Mollymook.
Make the call to inspect this property today.
Property History for 126 Mitchell Pde, Mollymook Beach, NSW 2539
- 20 May 2013Sold for $922,000
- 20 Apr 2013Listed for Sale $975,000
Commute Calculator
Recent sales nearby
See more recent sales nearby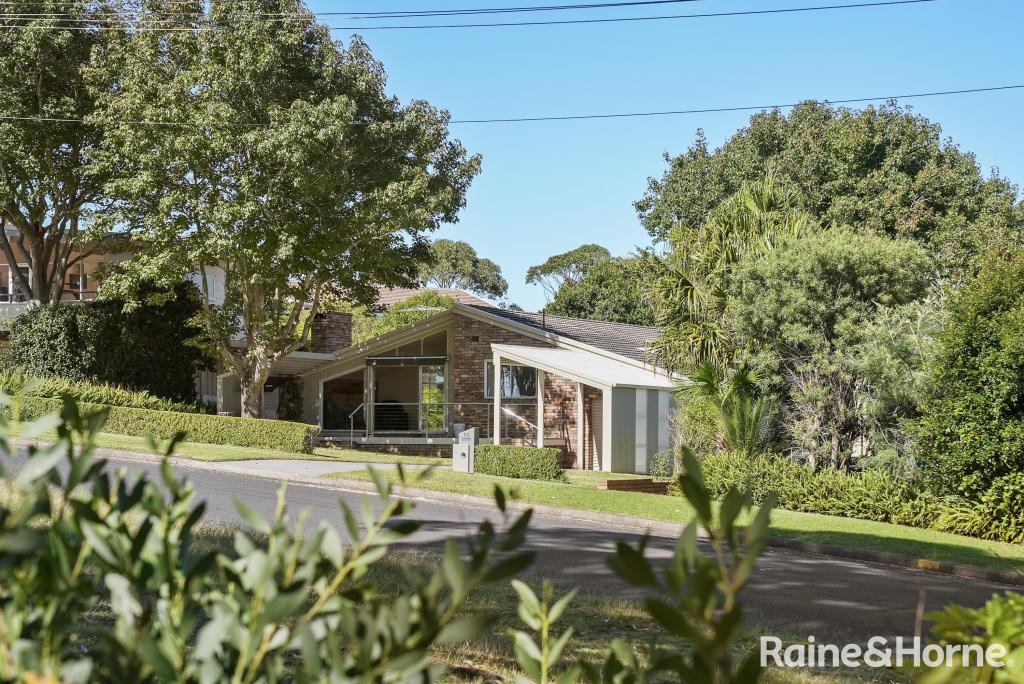 0
0
Similar properties For Sale nearby
See more properties for sale nearby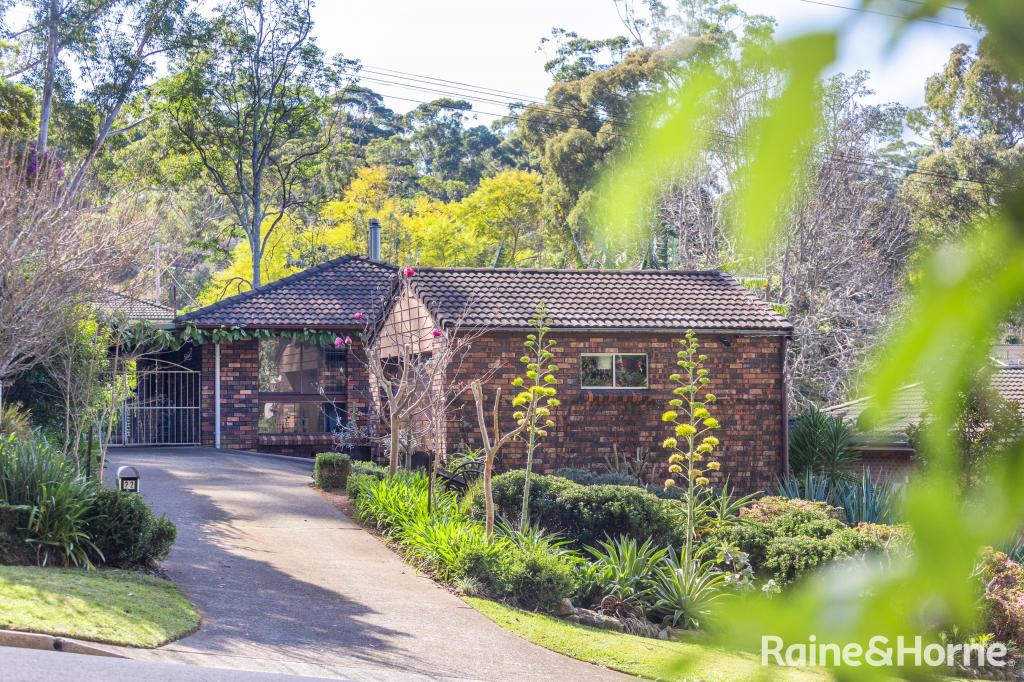 0
0
 0
0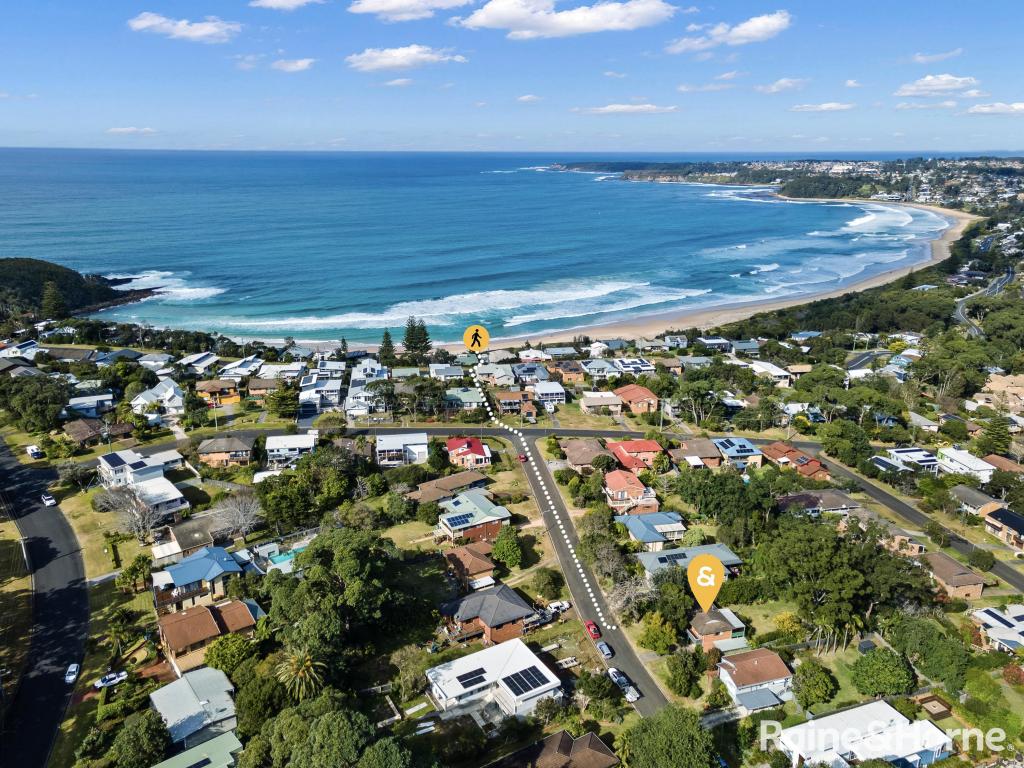 0
0Similar properties For Rent nearby
See more properties for rent nearby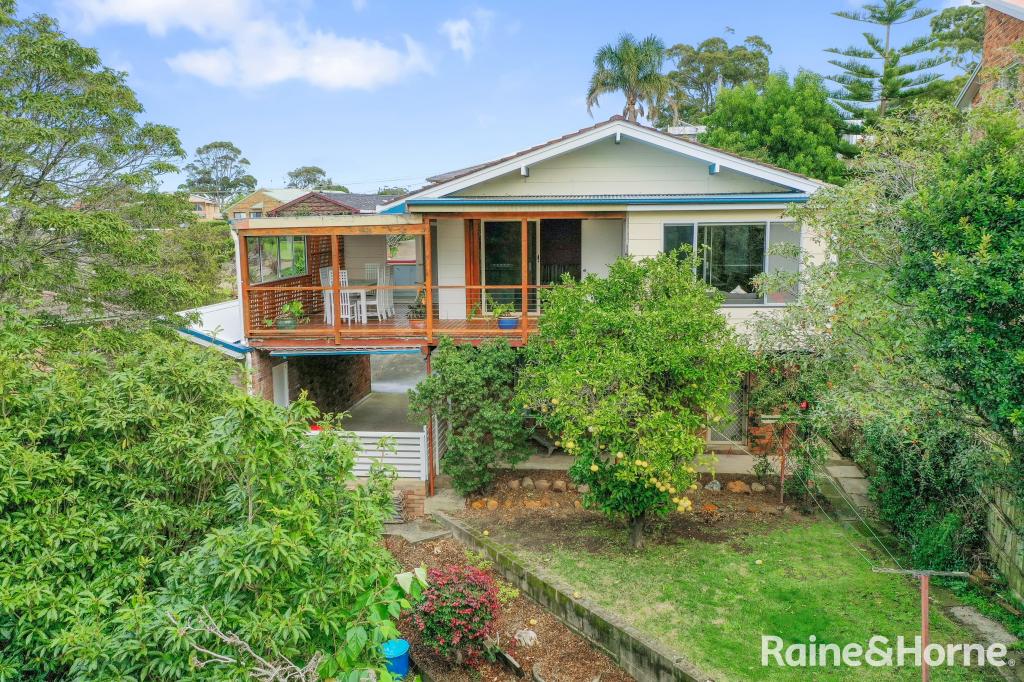 0
0 0
0 0
0
About Mollymook Beach 2539
The size of Mollymook Beach is approximately 3.3 square kilometres. It has 12 parks covering nearly 34.3% of total area. The population of Mollymook Beach in 2011 was 2,060 people. By 2016 the population was 2,446 showing a population growth of 18.7% in the area during that time. The predominant age group in Mollymook Beach is 60-69 years. Households in Mollymook Beach are primarily childless couples and are likely to be repaying $1800 - $2399 per month on mortgage repayments. In general, people in Mollymook Beach work in a professional occupation. In 2011, 72.8% of the homes in Mollymook Beach were owner-occupied compared with 77.3% in 2016.
Mollymook Beach has 1,969 properties. Over the last 5 years, Houses in Mollymook Beach have seen a 94.70% increase in median value, while Units have seen a 63.60% increase. As at 31 August 2024:
- The median value for Houses in Mollymook Beach is $1,114,318 while the median value for Units is $709,420.
- Houses have a median rent of $580 while Units have a median rent of $500.
Suburb Insights for Mollymook Beach 2539
Market Insights
Mollymook Beach Trends for Houses
N/A
N/A
View TrendN/A
N/A
Mollymook Beach Trends for Units
N/A
N/A
View TrendN/A
N/A
Neighbourhood Insights
© Copyright 2024 RP Data Pty Ltd trading as CoreLogic Asia Pacific (CoreLogic). All rights reserved.
This product uses cookies and other similar technologies to improve and customise your browsing experience, to tailor content and adverts, and for analytics and metrics regarding visitor usage on this product and other media. We may share cookie and analytics information with third parties for the purposes of advertising. By continuing to use our website, you consent to cookies being used. View our Privacy Policy here.
X