11 Bombora CrescentMollymook Beach NSW 2539
Property Details for 11 Bombora Cres, Mollymook Beach
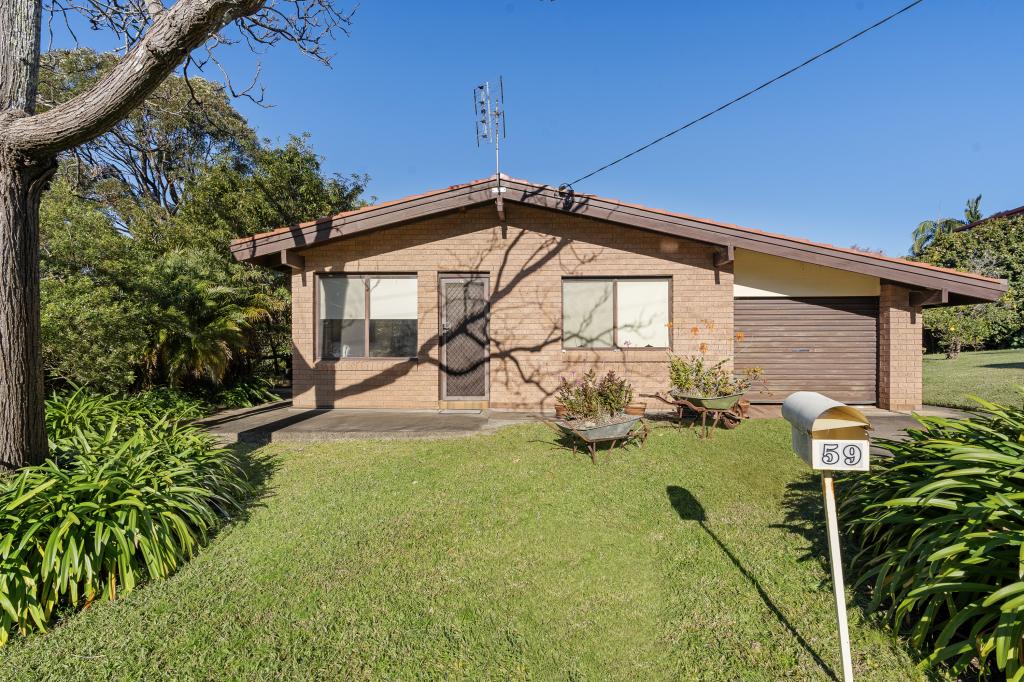
11 Bombora Cres, Mollymook Beach is a 3 bedroom, 1 bathroom House with 1 parking spaces and was built in 1985. The property has a land size of 787m2 and floor size of 112m2. While the property is not currently for sale or for rent, it was last sold in December 2016.
Last Listing description (June 2017)
Opportunity exists for investing or buying your own home. Lovely three bedroom home on a level block situated in a quiet area. Walk to Mollymook Shopping Centre and Mollymook Beach Bowling Club. Within walking distance to Mollymook's fantastic beautiful beach. Single lock up garage. Fully fenced back yard. Surrounded by established gardens and leafy vegetation. Whatever options you are after, either for holidays, retiring or lease, you won't go wrong with this beauty.
Property History for 11 Bombora Cres, Mollymook Beach, NSW 2539
- 26 Apr 2022Sold
- 29 Dec 2016Sold
- 16 Dec 2016Sold for $495,000
Commute Calculator
Recent sales nearby
See more recent sales nearbySimilar properties For Sale nearby
See more properties for sale nearby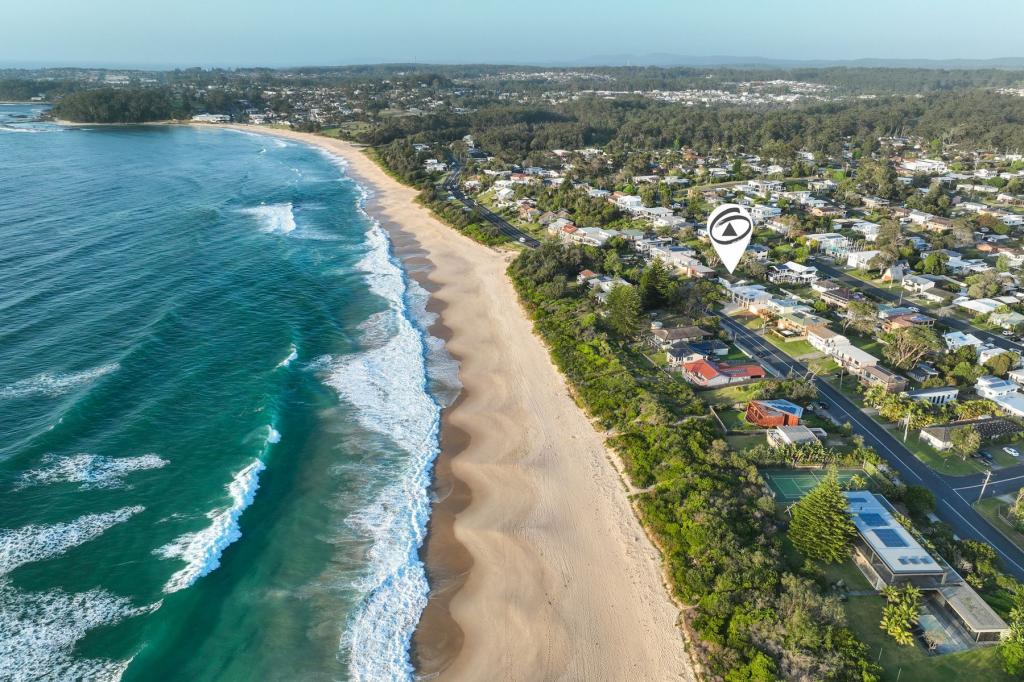 0
0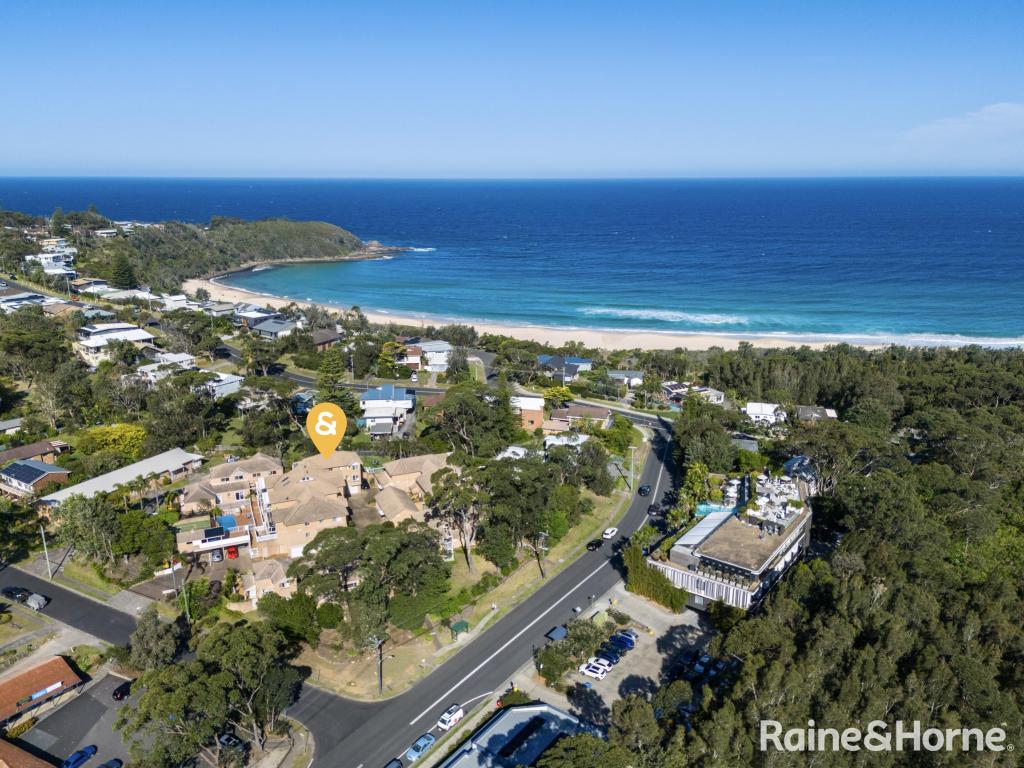 0
0
 0
0Similar properties For Rent nearby
See more properties for rent nearby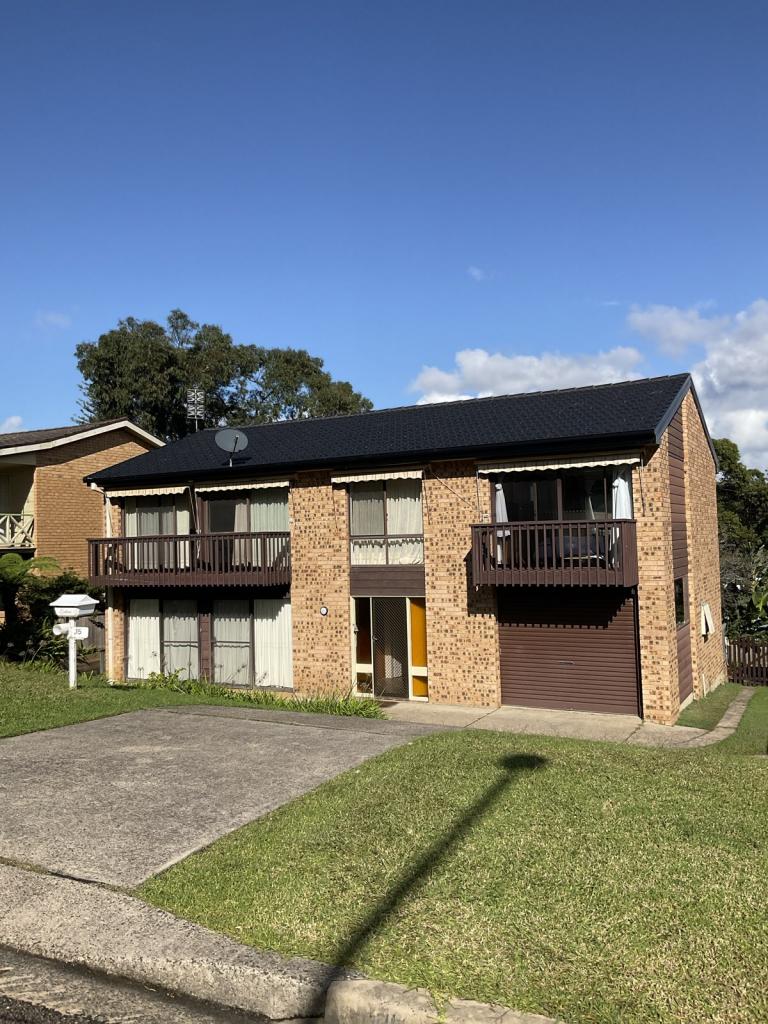 0
0 0
0
 0
0About Mollymook Beach 2539
The size of Mollymook Beach is approximately 3.3 square kilometres. It has 12 parks covering nearly 34.3% of total area. The population of Mollymook Beach in 2011 was 2,060 people. By 2016 the population was 2,446 showing a population growth of 18.7% in the area during that time. The predominant age group in Mollymook Beach is 60-69 years. Households in Mollymook Beach are primarily childless couples and are likely to be repaying $1800 - $2399 per month on mortgage repayments. In general, people in Mollymook Beach work in a professional occupation. In 2011, 72.8% of the homes in Mollymook Beach were owner-occupied compared with 77.3% in 2016.
Mollymook Beach has 1,976 properties. Over the last 5 years, Houses in Mollymook Beach have seen a 73.61% increase in median value, while Units have seen a 60.59% increase. As at 28 February 2025:
- The median value for Houses in Mollymook Beach is $1,053,477 while the median value for Units is $695,685.
- Houses have a median rent of $580 while Units have a median rent of $500.
Suburb Insights for Mollymook Beach 2539
Market Insights
Mollymook Beach Trends for Houses
N/A
N/A
View TrendN/A
N/A
Mollymook Beach Trends for Units
N/A
N/A
View TrendN/A
N/A
Neighbourhood Insights
© Copyright 2025 RP Data Pty Ltd trading as CoreLogic Asia Pacific (CoreLogic). All rights reserved.
This product uses cookies and other similar technologies to improve and customise your browsing experience, to tailor content and adverts, and for analytics and metrics regarding visitor usage on this product and other media. We may share cookie and analytics information with third parties for the purposes of advertising. By continuing to use our website, you consent to cookies being used. View our Privacy Policy here.
X