10/1 Mitchell ParadeMollymook Beach NSW 2539
Property Details for 10/1 Mitchell Pde, Mollymook Beach
10/1 Mitchell Pde, Mollymook Beach is a 1 bedroom, 1 bathroom Unit with 1 parking spaces and was built in 1975. The property has a land size of 1303m2 and floor size of 29m2. While the property is not currently for sale or for rent, it was last sold in December 2015.
Last Listing description (October 2016)
Bright and airy 1 bedroom unit directly across the road from gorgeous Mollymook Beach. With a proven rental history, this could be an ideal little property for your self managed super fund, or a first investment property or indeed just that weekend bolthole. Low maintenance and fantastic location - a winning combination.
Property History for 10/1 Mitchell Pde, Mollymook Beach, NSW 2539
- 15 Dec 2015Sold for $172,500
- 19 Aug 2015Listed for Sale Not Disclosed
- 08 May 2014Sold for $161,500
Commute Calculator
Similar properties For Sale nearby
See more properties for sale nearby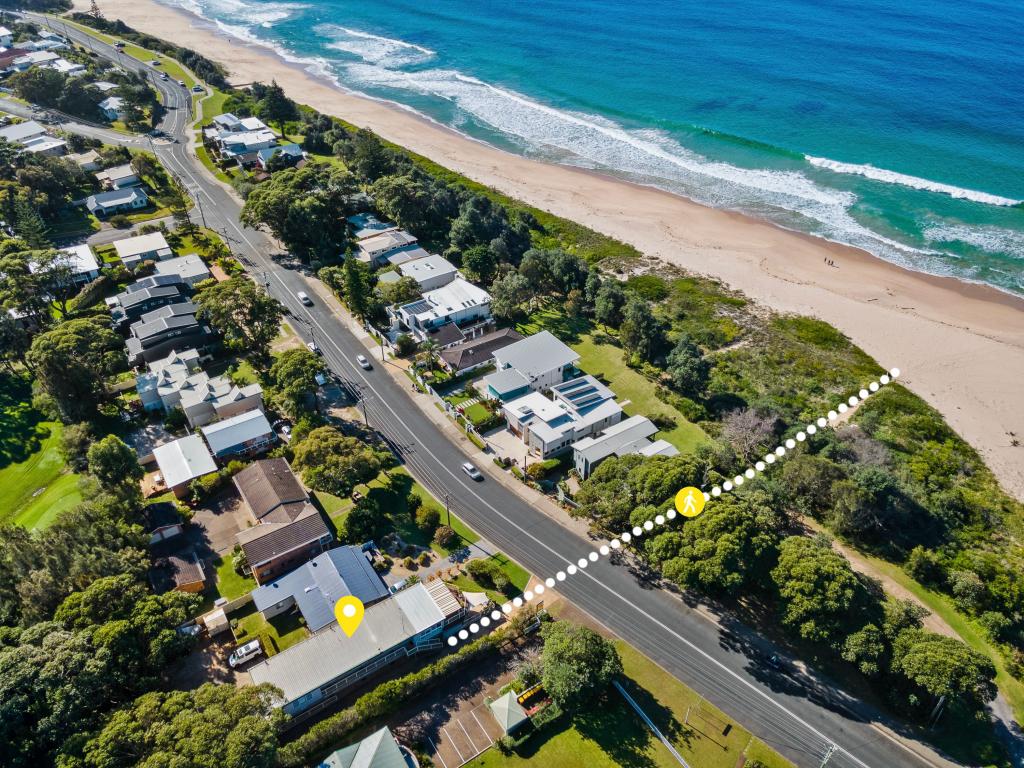 0
0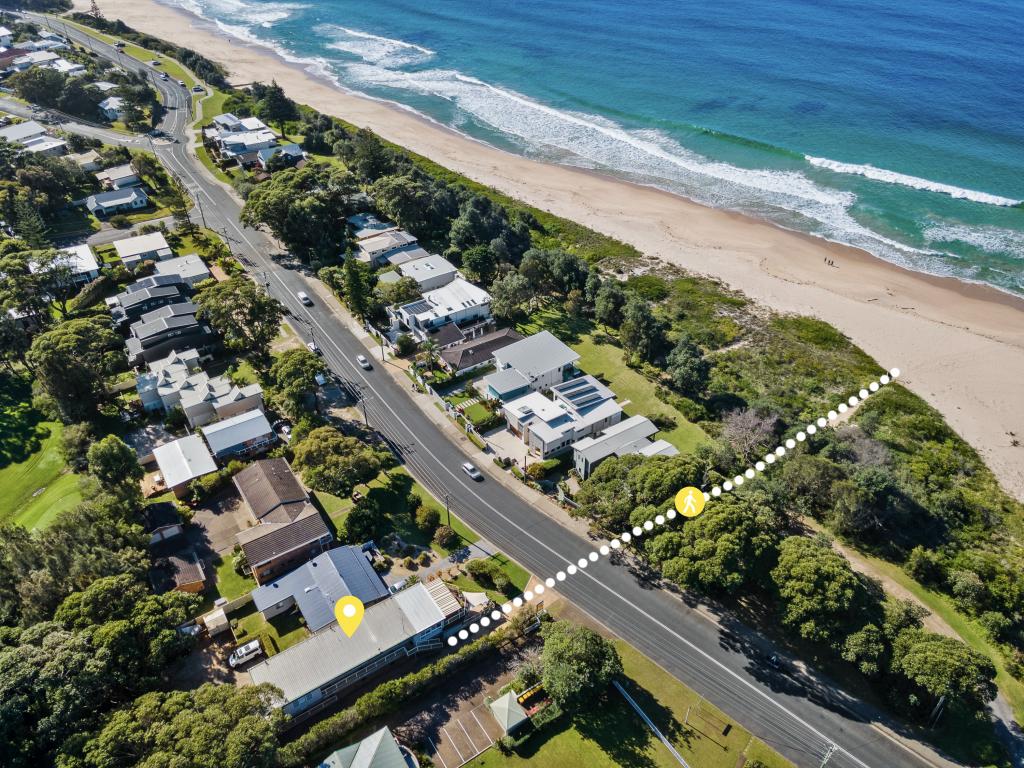 0
0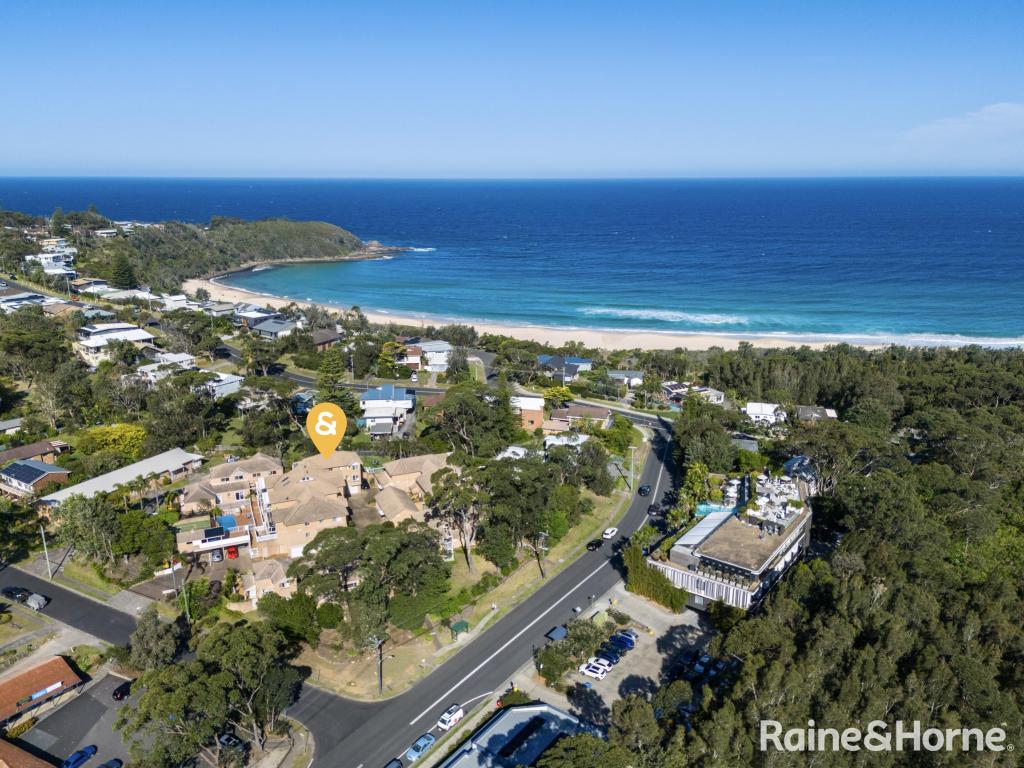 0
0
Similar properties For Rent nearby
See more properties for rent nearby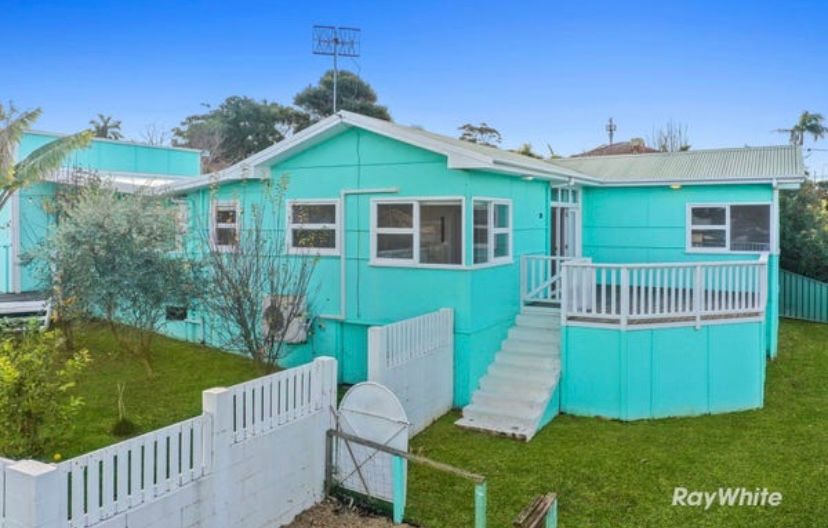 0
0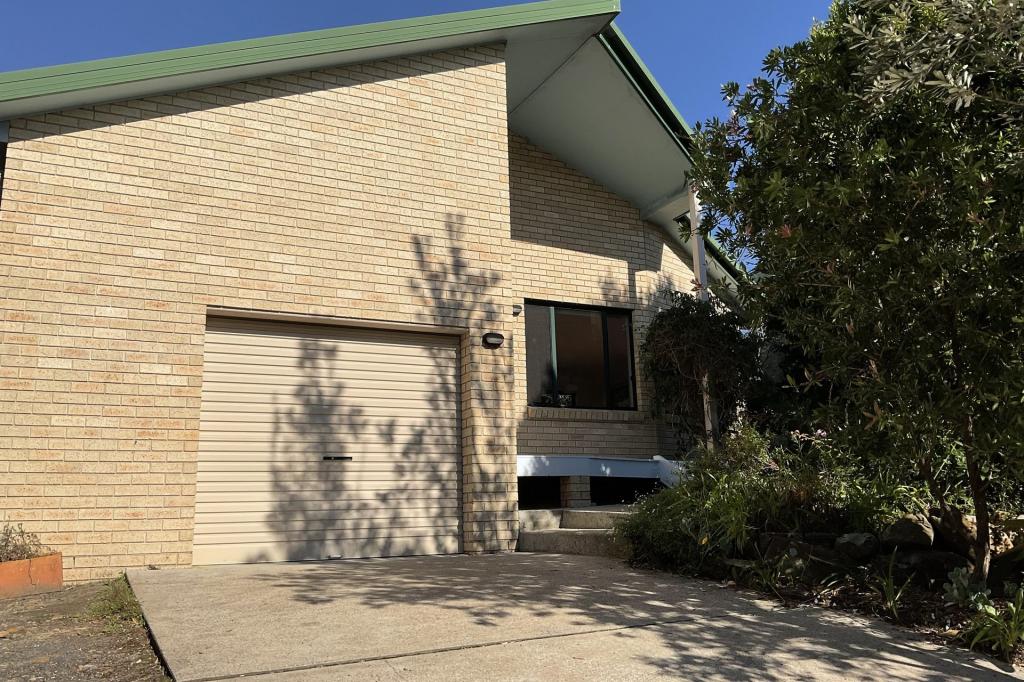 0
0 0
0
Suburb Insights for Mollymook Beach 2539
Market Insights
Mollymook Beach Trends for Houses
N/A
N/A
View TrendN/A
N/A
Mollymook Beach Trends for Units
N/A
N/A
View TrendN/A
N/A
Neighbourhood Insights
© Copyright 2024 RP Data Pty Ltd trading as CoreLogic Asia Pacific (CoreLogic). All rights reserved.
This product uses cookies and other similar technologies to improve and customise your browsing experience, to tailor content and adverts, and for analytics and metrics regarding visitor usage on this product and other media. We may share cookie and analytics information with third parties for the purposes of advertising. By continuing to use our website, you consent to cookies being used. View our Privacy Policy here.
X