Property Details for Lot 32/62 Molloy St, Mollymook
Last Listing description (September 2015)
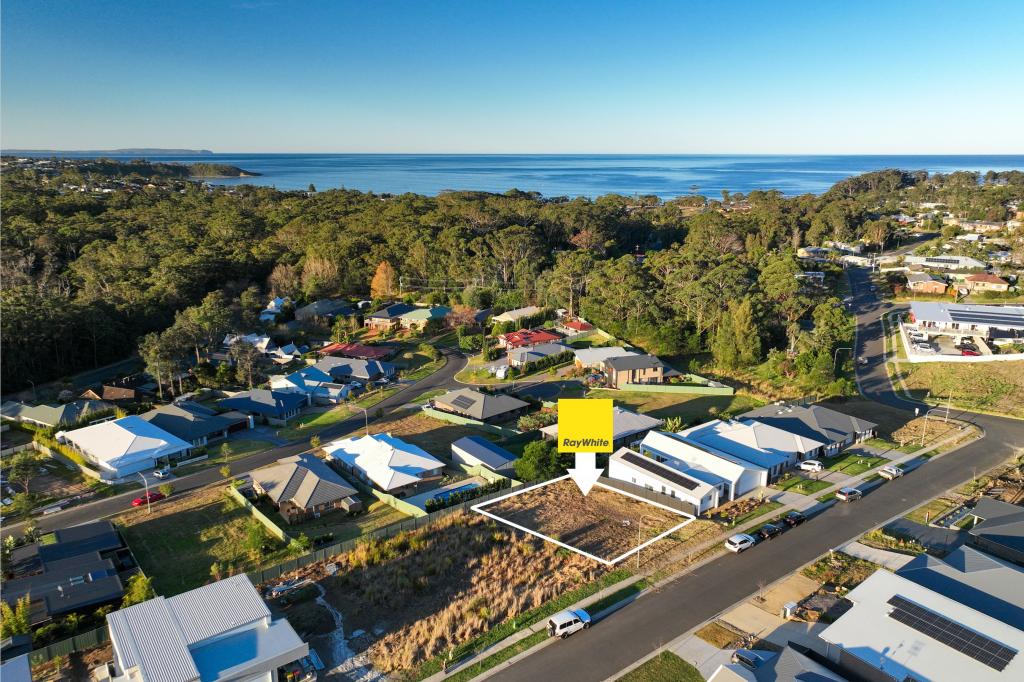
Close to Mollymook Beach and just a short drive to Milton & Ulladulla, these spacious blocks provide an excellent opportunity to secure a very good parcel of land with great investment potential. House and land packages available.
LOT STREET SIZE PRICE
34 MOLLOY STREET 1007M2 $217,000
36 MOLLOY STREET 833.9M2 UNDER OFFER
37 MOLLOY STREET 821.7M2 $197,000
38 MOLLOY STREET 731.5M2 UNDER OFFER
39 MOLLOY STREET 763.5M2 UNDER OFFER
40 MOLLOY STREET 775M2 $197,000
41 MOLLOY STREET 809.4M2 UNDER OFFER
42 MOLLOY STREET SOLD
43 MOLLOY STREET 682.8M2 $194,000
44 MOLLOY STREET 999.8M2 UNDER OFFER
45 MOLLOY STREET 1376M2 UNDER OFFER
46 MOLLOY STREET 1189M2 $217,000
47 MOLLOY STREET 702.7M2 UNDER OFFER
48 MOLLOY STREET 696.5M2 UNDER OFFER
49 MOLLOY STREET SOLD
50 MOLLOY STREET 936.2M2 $202,000
51 MOLLOY STREET 922.4M2 $202,000
52 MOLLOY STREET 915.6M2 UNDER OFFER
53 MOLLOY STREET 908.8M2 $202,000
54 MOLLOY STREET 819.2M2 $194,000
55 MOLLOY STREET 783.6M2 SOLD
56 MOLLOY STREET 725.6M2 $197,000
57 MOLLOY STREET 747M2 $197,000
58 MOLLOY STREET SOLD
59 MOLLOY STREET SOLD
60 MOLLOY STREET 695M2 $194,000
62 MOLLOY STREET 744.4M2 $205,000
Property History for Lot 32/62 Molloy St, Mollymook, NSW 2539
- 23 May 2015Listed for Sale FROM $194,000
Commute Calculator
Recent sales nearby
See more recent sales nearby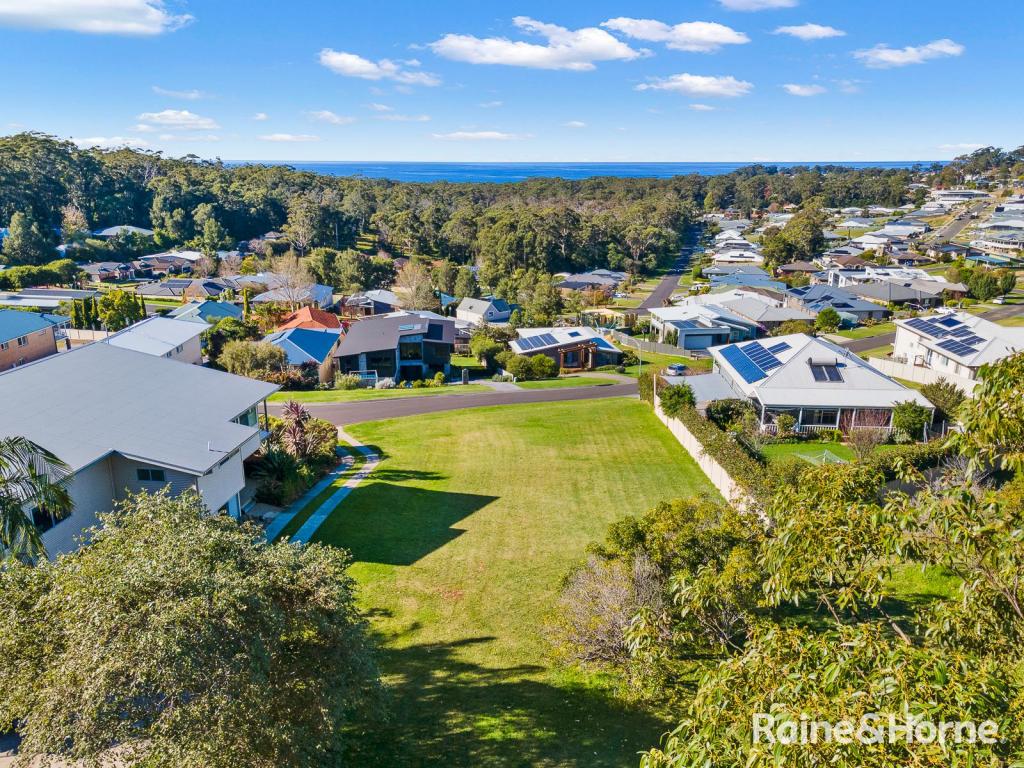 0
0
 0
0Similar properties For Sale nearby
See more properties for sale nearby 0
0 0
0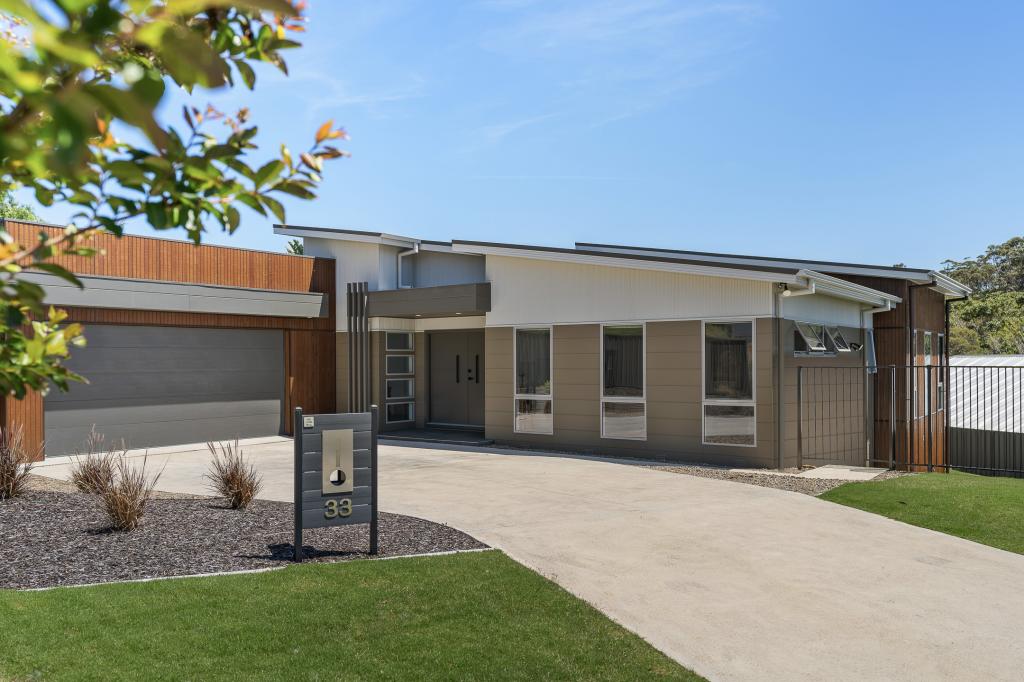 0
0Similar properties For Rent nearby
See more properties for rent nearby 0
0
 0
0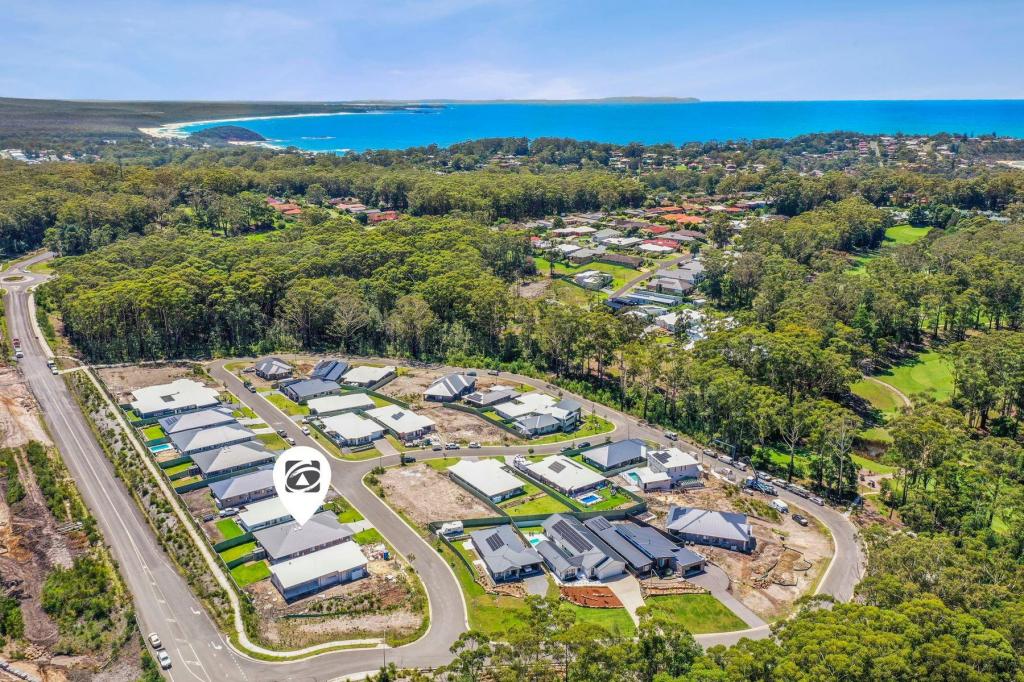 0
0About Mollymook 2539
The size of Mollymook is approximately 1.8 square kilometres. It has 8 parks covering nearly 25.4% of total area. The population of Mollymook in 2011 was 1,184 people. By 2016 the population was 1,068 showing a population decline of 9.8% in the area during that time. The predominant age group in Mollymook is 60-69 years. Households in Mollymook are primarily childless couples and are likely to be repaying $1000 - $1399 per month on mortgage repayments. In general, people in Mollymook work in a professional occupation. In 2011, 76.8% of the homes in Mollymook were owner-occupied compared with 73.9% in 2016.
Mollymook has 1,226 properties. Over the last 5 years, Houses in Mollymook have seen a 77.67% increase in median value, while Units have seen a 72.83% increase. As at 31 August 2024:
- The median value for Houses in Mollymook is $1,066,615 while the median value for Units is $692,235.
- Houses have a median rent of $640 while Units have a median rent of $453.
Suburb Insights for Mollymook 2539
Market Insights
Mollymook Trends for Houses
N/A
N/A
View TrendN/A
N/A
Mollymook Trends for Units
N/A
N/A
View TrendN/A
N/A
Neighbourhood Insights
© Copyright 2024 RP Data Pty Ltd trading as CoreLogic Asia Pacific (CoreLogic). All rights reserved.