849 Burrendong WayMarch NSW 2800
Property Details for 849 Burrendong Way, March
849 Burrendong Way, March is a 6 bedroom, 2 bathroom House and was built in 1970. The property has a land size of 4047m2 and floor size of 367m2. While the property is not currently for sale or for rent, it was last sold in November 2013.
Last Listing description (October 2013)
More Than Meets the Eye
This renovated home is situated on 1 acre of picturesque landscaped gardens only minutes from town with room for everything and everyone. The main home is on the upper level with three bedrooms plus an office/fourth bedroom. The modern sunny kitchen is part of the large open plan dining and lounge area that flows onto a fabulous deck overlooking the front yard. The lower level features a huge rumpus room with enough room for the pool table and the children along with a 3rd toilet. The fully self contained second residence is also on the lower level and features two bedrooms with the main having a dressing room that would rival most third bedrooms.
The living areas feature polished timber floors and a wonderful outlook. The space does not stop there. The shed space in this property has enough room for 4 cars as well as the family boat, trailer, motorbikes, mowers and anything else you want to put in it. It is huge. Call today to have a look at this unique home.
Property History for 849 Burrendong Way, March, NSW 2800
- 06 Nov 2013Sold for $522,000
- 15 May 2013Listed for Sale $539,990
- 24 Nov 2012Listed for Sale $595,000
Commute Calculator
Recent sales nearby
See more recent sales nearby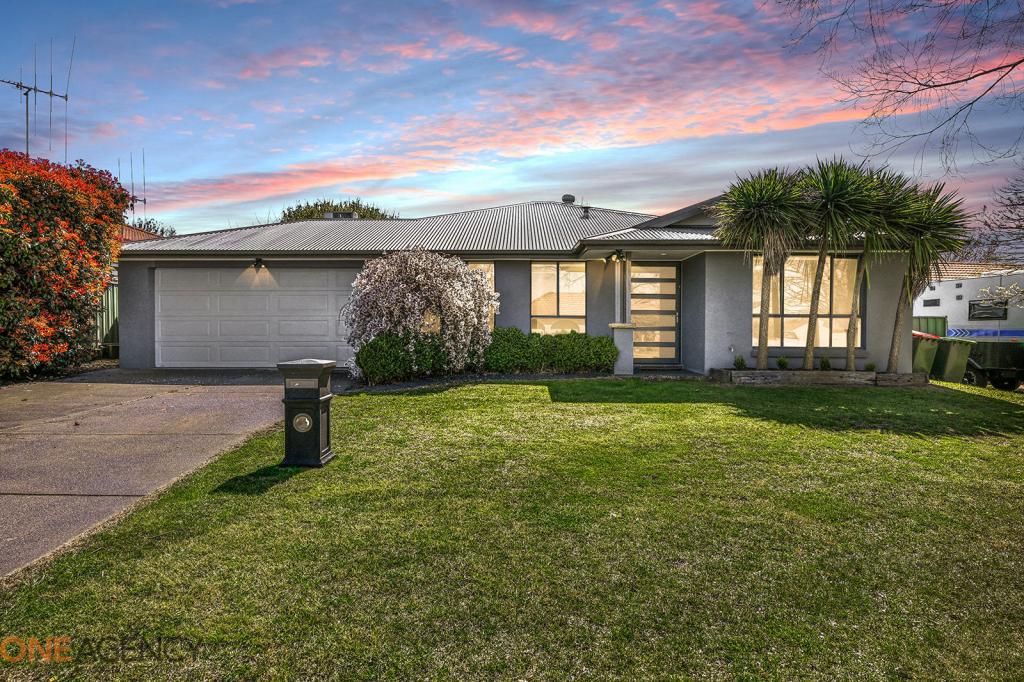 0
0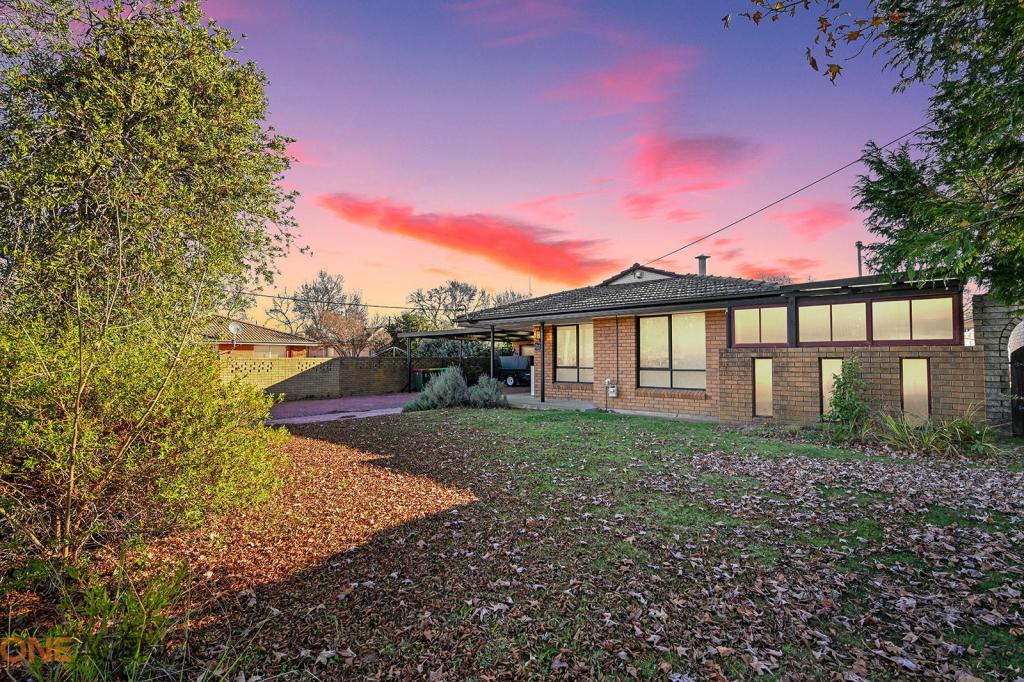 0
0Similar properties For Sale nearby
See more properties for sale nearby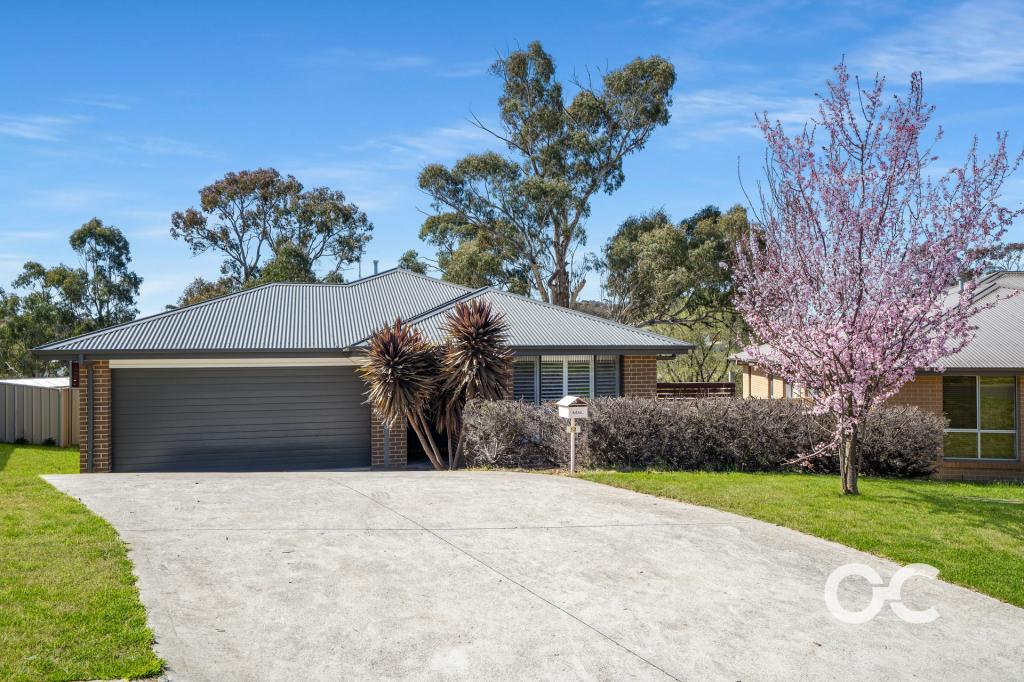 0
0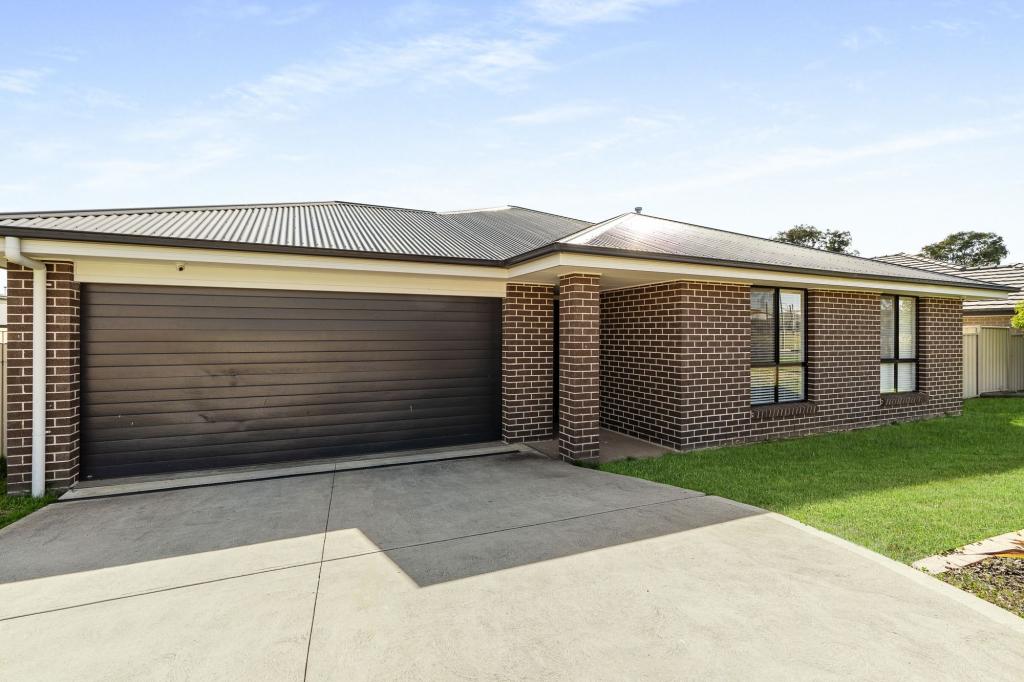 0
0 0
0About March 2800
The size of March is approximately 13.4 square kilometres. The population of March in 2011 was 529 people. By 2016 the population was 110 showing a population decline of 79.2% in the area during that time. The predominant age group in March is 60-69 years. Households in March are primarily childless couples and are likely to be repaying $2400 - $2999 per month on mortgage repayments. In general, people in March work in a managers occupation. In 2011, 87.2% of the homes in March were owner-occupied compared with 76.9% in 2016..
March has 51 properties. Over the last 5 years, Houses in March have seen a 54.81% increase in median value, while Units have seen a 191.57% increase. As at 30 September 2024:
- The median value for Houses in March is $968,374 while the median value for Units is $490,139.
Suburb Insights for March 2800
Market Insights
March Trends for Houses
N/A
N/A
View TrendN/A
N/A
March Trends for Units
N/A
N/A
View TrendN/A
N/A
Neighbourhood Insights
© Copyright 2024 RP Data Pty Ltd trading as CoreLogic Asia Pacific (CoreLogic). All rights reserved.
This product uses cookies and other similar technologies to improve and customise your browsing experience, to tailor content and adverts, and for analytics and metrics regarding visitor usage on this product and other media. We may share cookie and analytics information with third parties for the purposes of advertising. By continuing to use our website, you consent to cookies being used. View our Privacy Policy here.
X