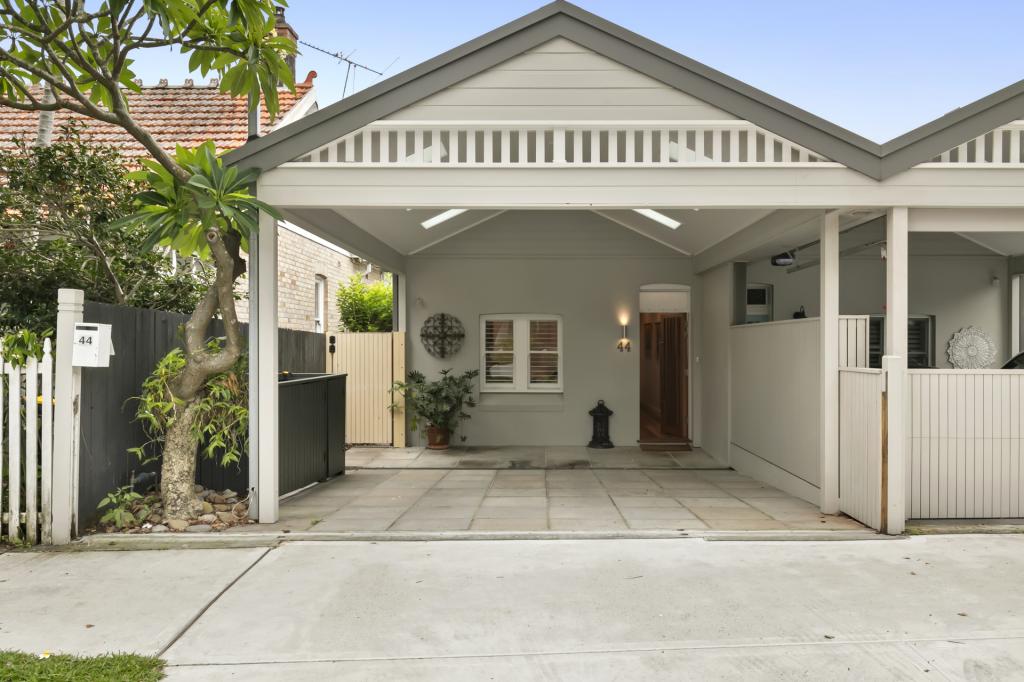
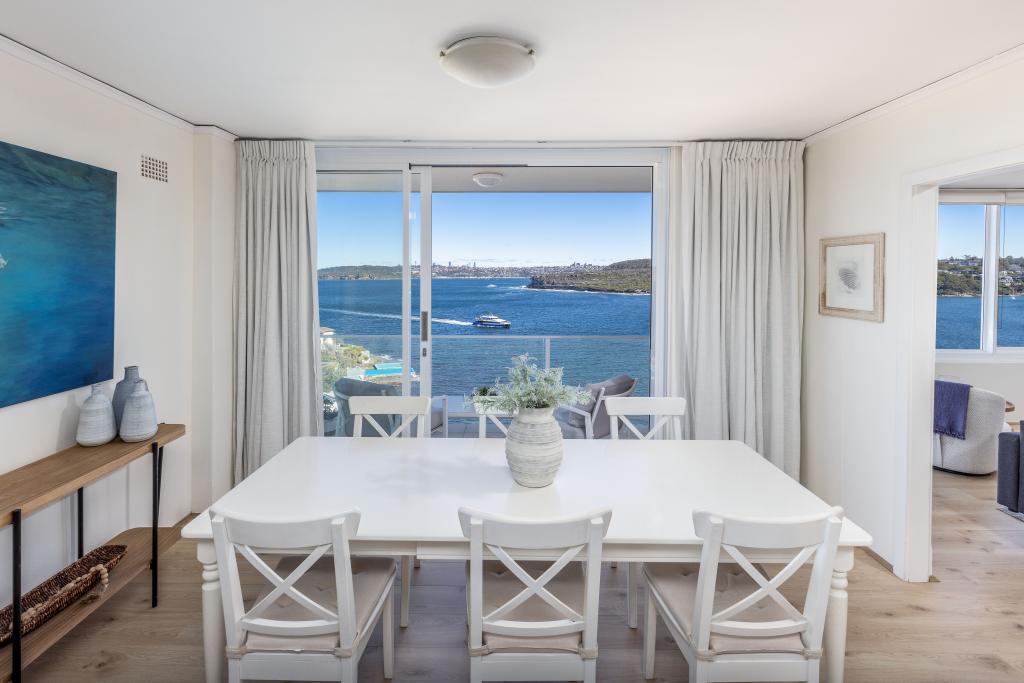
9 Pine StreetManly NSW 2095
Property Details for 9 Pine St, Manly
9 Pine St, Manly is a 3 bedroom, 2 bathroom House with 2 parking spaces. The property has a land size of 265m2 and floor size of 141m2. While the property is not currently for sale or for rent, it was last sold in February 2025. There are 7 other 3 bedroom Houses sold in Manly in the last 12 months.
Property History for 9 Pine St, Manly, NSW 2095
- 22 Feb 2025Sold
- 19 Dec 2018Sold
Recent sales nearby
See more recent sales nearbySimilar properties For Sale nearby
See more properties for sale nearby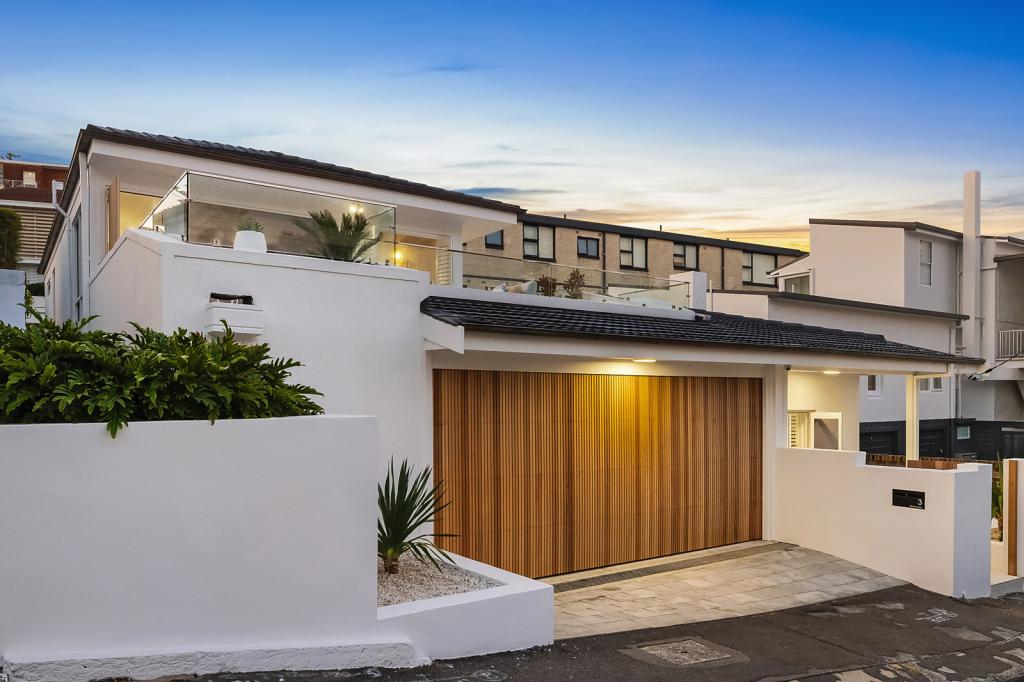

Similar properties For Rent nearby
See more properties for rent nearby
About Manly 2095
The size of Manly is approximately 5.6 square kilometres. It has 19 parks covering nearly 47.5% of total area. The population of Manly in 2011 was 15,072 people. By 2016 the population was 15,861 showing a population growth of 5.2% in the area during that time. The predominant age group in Manly is 30-39 years. Households in Manly are primarily childless couples and are likely to be repaying over $4000 per month on mortgage repayments. In general, people in Manly work in a professional occupation. In 2011, 45% of the homes in Manly were owner-occupied compared with 45.7% in 2016.
Manly has 11,211 properties. Over the last 5 years, Houses in Manly have seen a 20.79% increase in median value, while Units have seen a 14.70% increase. As at 31 March 2025:
- The median value for Houses in Manly is $3,665,241 while the median value for Units is $1,723,465.
- Houses have a median rent of $1,190 while Units have a median rent of $950.
What's around 9 Pine St, Manly
9 Pine St, Manly is in the school catchment zone for Manly Village Public School and Northern Beaches Secondary College Mackellar Girls Campus.


Suburb Insights for Manly 2095
Market Insights
Manly Trends for Houses
$3.67M
-14.03%
View Trend$1.19k/W
2.10%
Manly Trends for Units
$1.72M
-5.20%
View Trend$950/W
2.76%
Neighbourhood Insights
Age
Population 15,861
0-9
10%
10-19
7%
20-29
16%
30-39
23%
40-49
14%
50-59
11%
60-69
9%
70-79
6%
80-89
3%
90-99
1%
Household Structure
Occupancy
© Copyright 2025 RP Data Pty Ltd trading as CoreLogic Asia Pacific (CoreLogic). All rights reserved.
This product uses cookies and other similar technologies to improve and customise your browsing experience, to tailor content and adverts, and for analytics and metrics regarding visitor usage on this product and other media. We may share cookie and analytics information with third parties for the purposes of advertising. By continuing to use our website, you consent to cookies being used. View our Privacy Policy here.
X