6 Wychewood AvenueMallabula NSW 2319
Property Details for 6 Wychewood Ave, Mallabula
6 Wychewood Ave, Mallabula is a 4 bedroom, 2 bathroom House with 2 parking spaces and was built in 1999. The property has a land size of 838m2 and floor size of 208m2. While the property is not currently for sale or for rent, it was last sold in March 2024. There are other 4 bedroom House sold in Mallabula in the last 12 months.
Last Listing description (May 2011)
Beautifully Presented
This immaculately presented brick & tile home is set in a popular street, close to swimming pool & sporting complex, short stroll to popular picnic grounds, waterfront reserve, shopping centre & school.
Features include 4 bedrooms (ensuite to the main)all with built-ins, formal & informal living areas, family room with galley style kitchen, attached single garage & a large colour bond shed in the back yard. Beautifully landscaped gardens complete the picture.
Additional feature/s - Built-In Wardrobes.
Property History for 6 Wychewood Ave, Mallabula, NSW 2319
- 22 Mar 2024Sold for $825,000
- 03 Nov 2021Sold for $600,000
- 13 May 2011Sold for $375,000
Commute Calculator
Recent sales nearby
See more recent sales nearby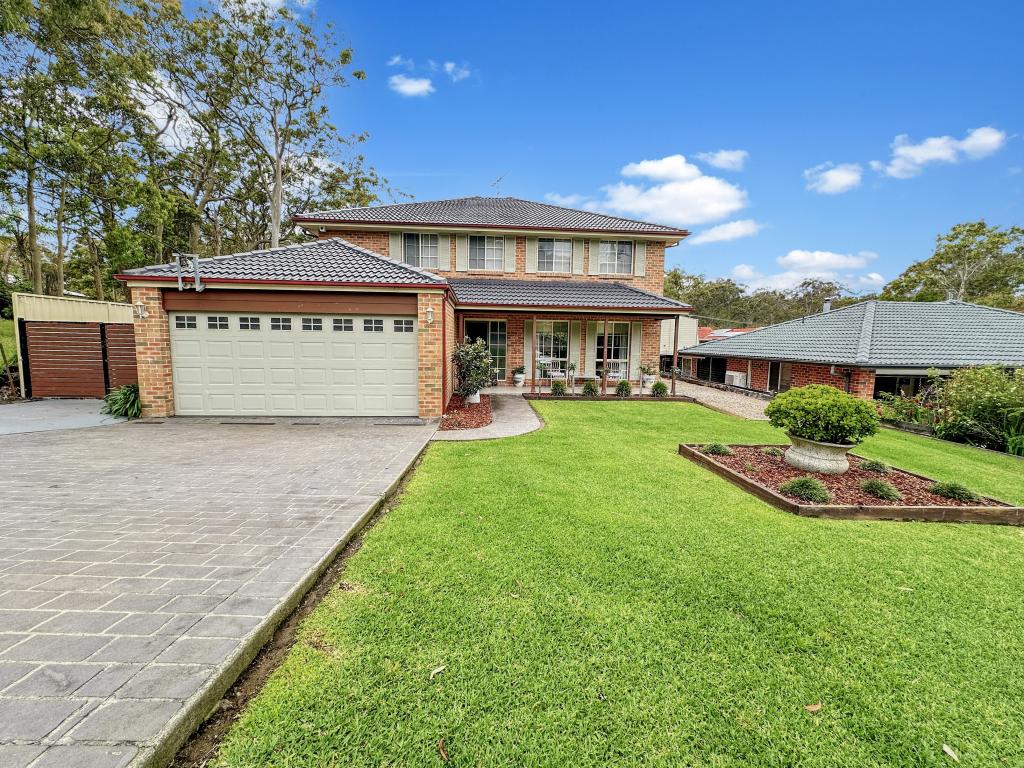 0
0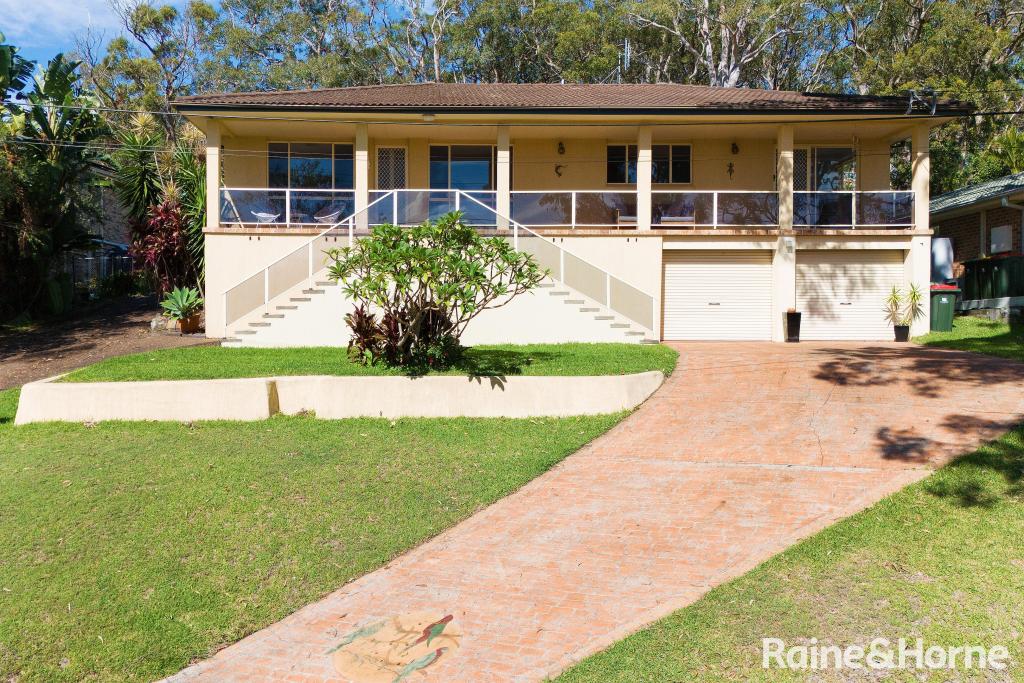 0
0
Similar properties For Sale nearby
See more properties for sale nearby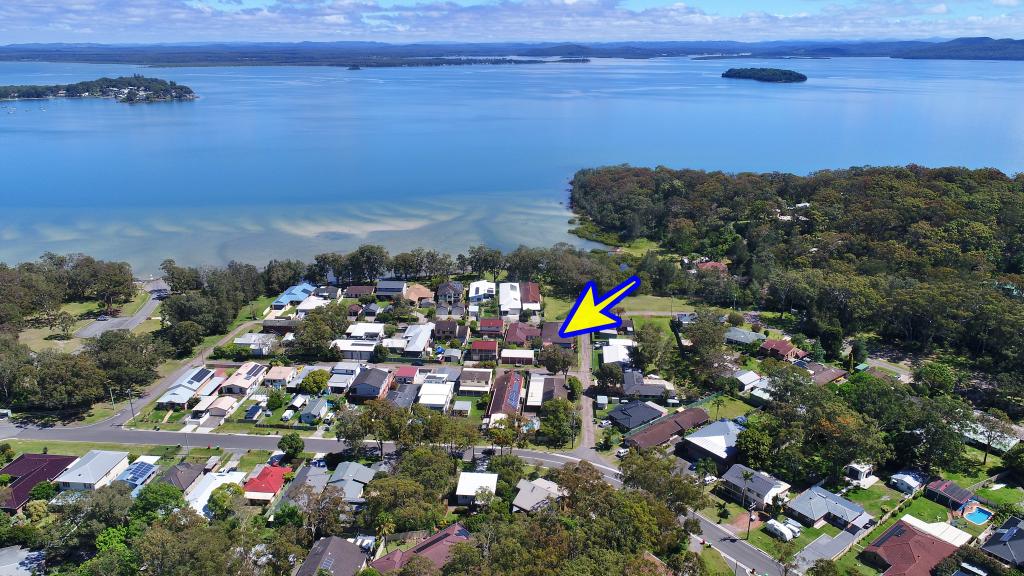 0
0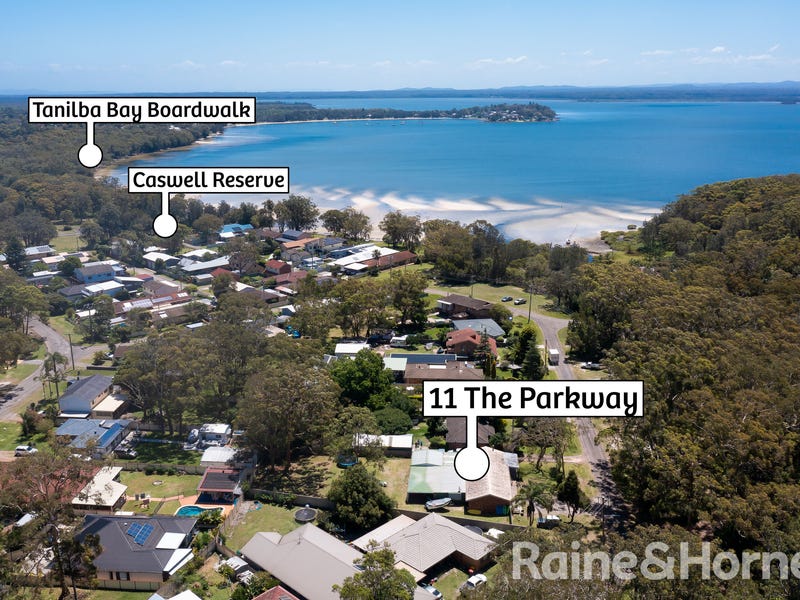 0
0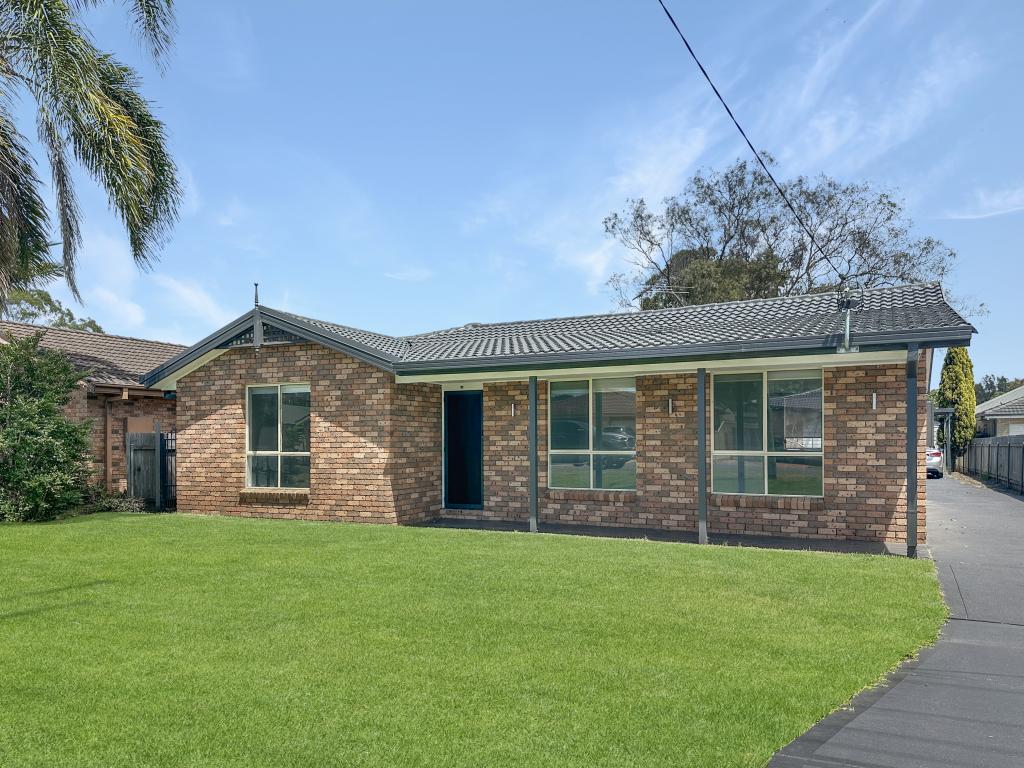 0
0 0
0About Mallabula 2319
The size of Mallabula is approximately 2.7 square kilometres. It has 9 parks covering nearly 16.5% of total area. The population of Mallabula in 2011 was 850 people. By 2016 the population was 928 showing a population growth of 9.2% in the area during that time. The predominant age group in Mallabula is 50-59 years. Households in Mallabula are primarily childless couples and are likely to be repaying $1400 - $1799 per month on mortgage repayments. In general, people in Mallabula work in a trades occupation. In 2011, 68.8% of the homes in Mallabula were owner-occupied compared with 71.1% in 2016.
Mallabula has 506 properties. Over the last 5 years, Houses in Mallabula have seen a 53.01% increase in median value, while Units have seen a 52.81% increase. As at 30 November 2024:
- The median value for Houses in Mallabula is $662,479 while the median value for Units is $451,791.
- Houses have a median rent of $575 while Units have a median rent of $300.
Suburb Insights for Mallabula 2319
Market Insights
Mallabula Trends for Houses
N/A
N/A
View TrendN/A
N/A
Mallabula Trends for Units
N/A
N/A
View TrendN/A
N/A
Neighbourhood Insights
© Copyright 2024 RP Data Pty Ltd trading as CoreLogic Asia Pacific (CoreLogic). All rights reserved.
This product uses cookies and other similar technologies to improve and customise your browsing experience, to tailor content and adverts, and for analytics and metrics regarding visitor usage on this product and other media. We may share cookie and analytics information with third parties for the purposes of advertising. By continuing to use our website, you consent to cookies being used. View our Privacy Policy here.
X