14A Wychewood AvenueMallabula NSW 2319
Property Details for 14a Wychewood Ave, Mallabula
14a Wychewood Ave, Mallabula is a 3 bedroom, 2 bathroom House with 2 parking spaces and was built in 2008. The property has a land size of 329m2 and floor size of 139m2. While the property is not currently for sale or for rent, it was last sold in June 2012.
Last Listing description (July 2012)
TORRENS TITLE DUPLEX
IMMACULATELY PRESENTED HOME CLOSE TO THE LOCAL SPORTING COMPLEX AND SWIIMING POOL. THIS PROPERTY IS LESS THAN FIVE YEARS OLD AND OFFERS A HOST OF QUALITY INCLUSIONS AND INCLUDES A LARGE 'OPEN PLAN' LOUNGE/DINING AREA 'GALLEY STLYE' KITCHEN WITH WALK IN PANRTY AND STAINLESS STEEL APPLIANCES; THREE BEDROOMS (ENSUITE TO THE MAIN) WITH BUILT IN WARDROBES; LAUNDRY; DOUBLE GARAGE WITH INTERNAL ACCESS; LARGE TIMBER DECK OFF THE LIVING AREA FOR OUTDOOR ENTERTAINING.
Property History for 14a Wychewood Ave, Mallabula, NSW 2319
- 27 Nov 2014Listed for Rent - Price not available
- 05 Jun 2012Sold for $285,000
- 25 Jan 2012Listed for Sale $295,000
Commute Calculator
Recent sales nearby
See more recent sales nearby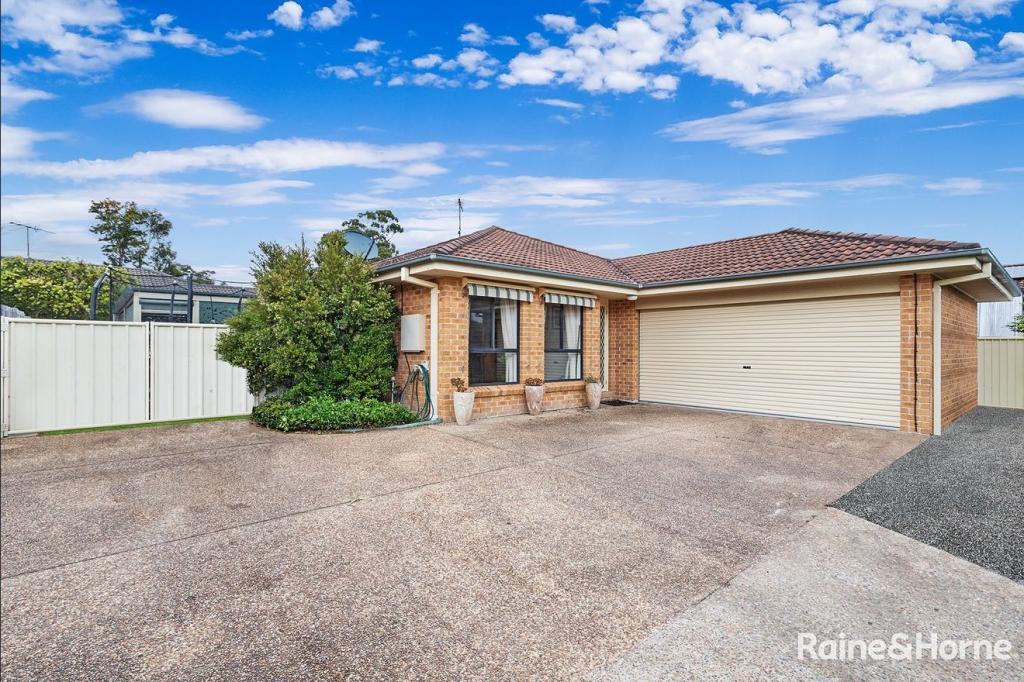 0
0Similar properties For Sale nearby
See more properties for sale nearby 0
0 0
0
 0
0Similar properties For Rent nearby
See more properties for rent nearby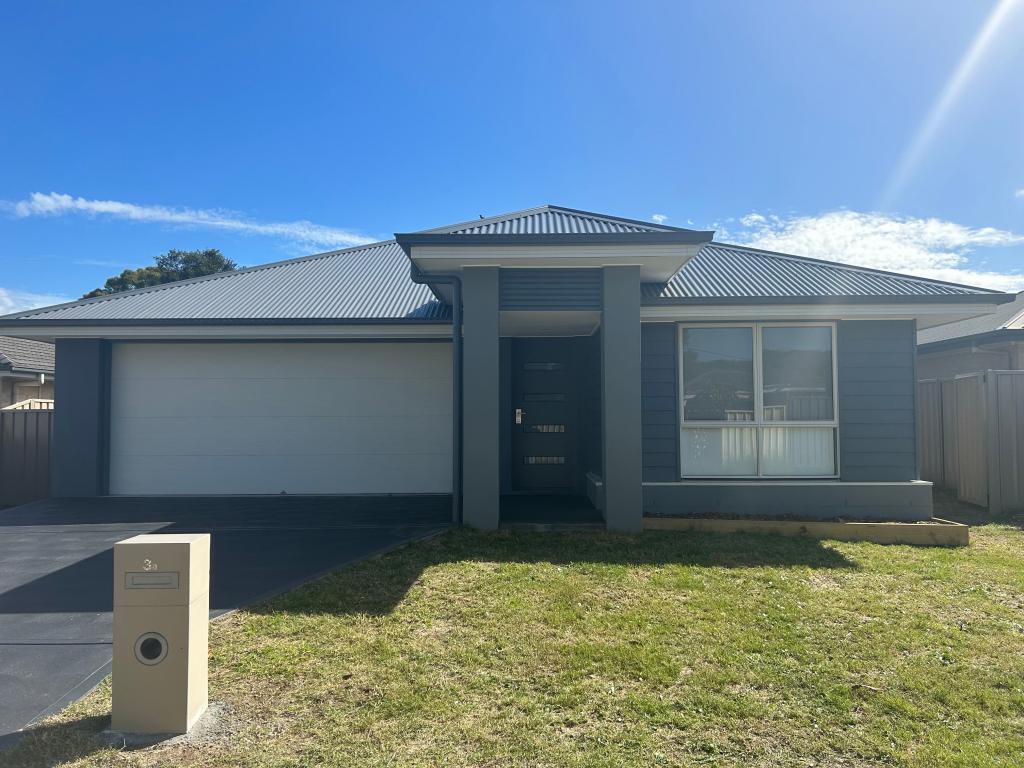 0
0 0
0 0
0About Mallabula 2319
The size of Mallabula is approximately 2.7 square kilometres. It has 9 parks covering nearly 16.5% of total area. The population of Mallabula in 2011 was 850 people. By 2016 the population was 928 showing a population growth of 9.2% in the area during that time. The predominant age group in Mallabula is 50-59 years. Households in Mallabula are primarily childless couples and are likely to be repaying $1400 - $1799 per month on mortgage repayments. In general, people in Mallabula work in a trades occupation. In 2011, 68.8% of the homes in Mallabula were owner-occupied compared with 71.1% in 2016.
Mallabula has 504 properties. Over the last 5 years, Houses in Mallabula have seen a 68.20% increase in median value, while Units have seen a 41.57% increase. As at 31 July 2024:
- The median value for Houses in Mallabula is $702,904 while the median value for Units is $449,583.
- Houses have a median rent of $560 while Units have a median rent of $270.
Suburb Insights for Mallabula 2319
Market Insights
Mallabula Trends for Houses
N/A
N/A
View TrendN/A
N/A
Mallabula Trends for Units
N/A
N/A
View TrendN/A
N/A
Neighbourhood Insights
© Copyright 2024 RP Data Pty Ltd trading as CoreLogic Asia Pacific (CoreLogic). All rights reserved.
This product uses cookies and other similar technologies to improve and customise your browsing experience, to tailor content and adverts, and for analytics and metrics regarding visitor usage on this product and other media. We may share cookie and analytics information with third parties for the purposes of advertising. By continuing to use our website, you consent to cookies being used. View our Privacy Policy here.
X