176 Busby RoadLower Belford NSW 2335
Property Details for 176 Busby Rd, Lower Belford
Last Listing description (March 2016)
Just minutes from Hunter Expressway, makes this property just 45 mins to Newcastle or 5 mins to Branxton.
Situated in the sleepy village of Lower Belford you will find this lovely rural grazing property of 70 acres with creek frontage, river & 9 Meg Water Licence. All of the land is cleared, arable and fully fenced into several paddocks with dams.
This property is ideal for horses, cattle etc
Beautifully presented, this 3 bedroom brick home with timber kitchen and open plan living areas offers you a warm relaxing feeling.
All bedrooms are well sized and have built in robes and ceiling fans. The main bedroom has sliding doors opening to the front veranda and stunning rural views. The open plan living area contains a wood fire and air conditioning.
From the kitchen you have views over the sparkling in ground pool.
Primary school is down the road, high school bus is close by to both Maitland & Singleton schools.
This is an outstanding parcel of land often sought but rarely found. Inspection is by appointment
Property History for 176 Busby Rd, Lower Belford, NSW 2335
- 04 Dec 2015Sold for $870,000
- 10 Apr 2015Listed for Sale $850,000
- 29 Oct 2009Sold for $800,000
Commute Calculator
Recent sales nearby
See more recent sales nearby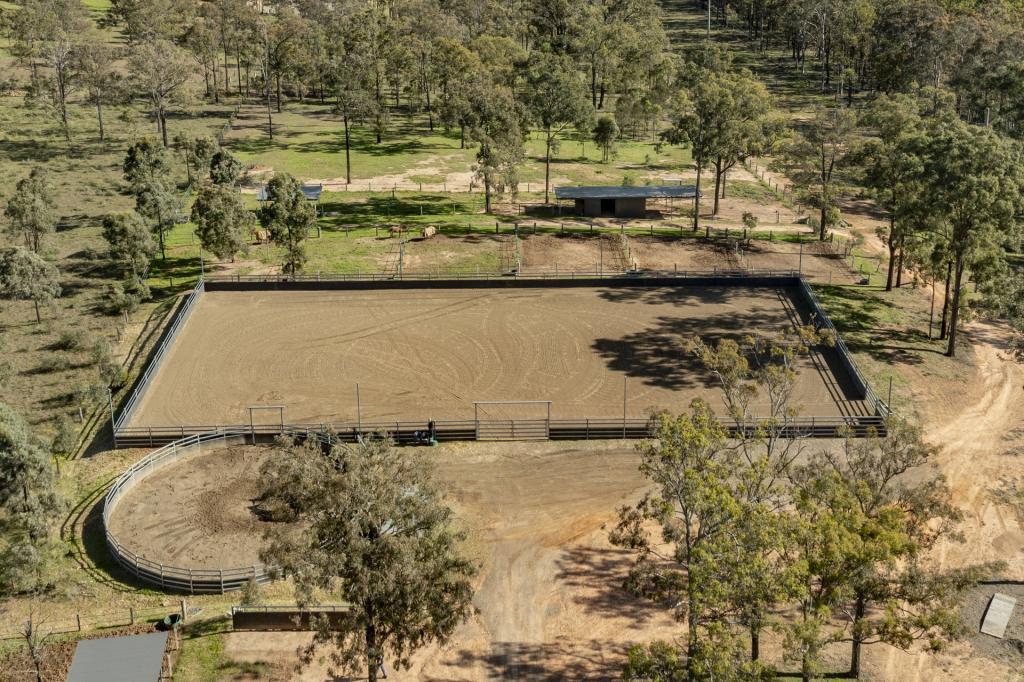 0
0
About Lower Belford 2335
The size of Lower Belford is approximately 41.8 square kilometres. It has 1 park. The population of Lower Belford in 2011 was 383 people. By 2016 the population was 394 showing a population growth of 2.9% in the area during that time. The predominant age group in Lower Belford is 50-59 years. Households in Lower Belford are primarily couples with children and are likely to be repaying $1800 - $2399 per month on mortgage repayments. In general, people in Lower Belford work in a managers occupation. In 2011, 84.7% of the homes in Lower Belford were owner-occupied compared with 85% in 2016.
Lower Belford has 202 properties.
Suburb Insights for Lower Belford 2335
Market Insights
Trends for Houses
N/A
N/A
View TrendN/A
N/A
Trends for Units
N/A
N/A
View TrendN/A
N/A
Neighbourhood Insights
© Copyright 2024 RP Data Pty Ltd trading as CoreLogic Asia Pacific (CoreLogic). All rights reserved.
This product uses cookies and other similar technologies to improve and customise your browsing experience, to tailor content and adverts, and for analytics and metrics regarding visitor usage on this product and other media. We may share cookie and analytics information with third parties for the purposes of advertising. By continuing to use our website, you consent to cookies being used. View our Privacy Policy here.
X