7/29 Minnamurra StreetKiama NSW 2533
Property Details for 7/29 Minnamurra St, Kiama
7/29 Minnamurra St, Kiama is a 1 bedroom, 1 bathroom Unit with 1 parking spaces and was built in 1980. The property has a land size of 1495m2. While the property is not currently for sale or for rent, it was last sold in July 2008.
Last Listing description (May 2008)
AUCTION. HARBOUR VIEWS - WALK TO EVERYTHING!
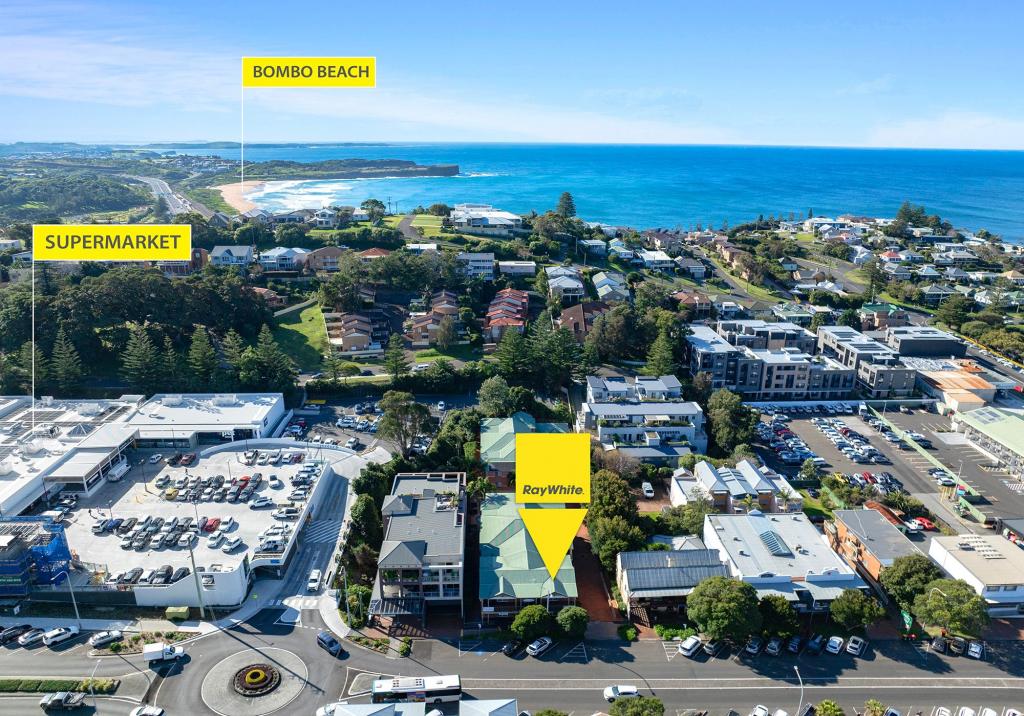
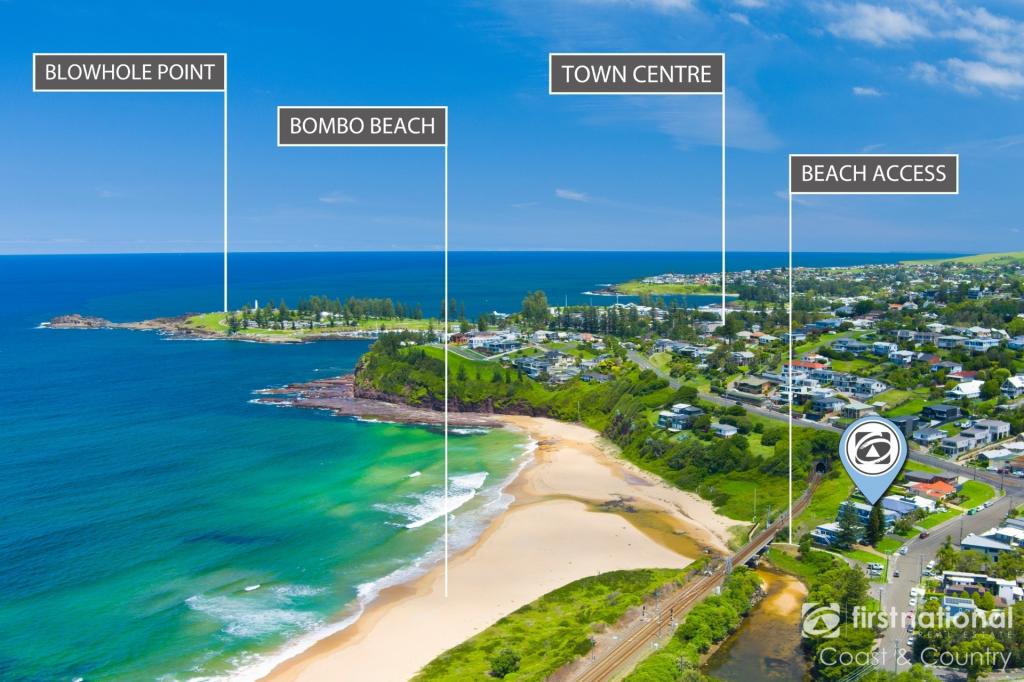
WITH KNOCKOUT VIEWS OF KIAMA'S HARBOUR & TOWNSHIP, THIS WARM & SUNNY EAST-FACING UNIT FEATURES BRIGHT & SPACIOUS LIVING, 2 LARGE BEDROOMS, BALCONY WITH VIEWS, ALL IN GREAT CONDITION AND READY TO MOVE IN OR RENT OUT. ALSO INCLUDES 2 SEPARATE GARAGES, ONE OF THESE BEING VERY LARGE. HIGHLY SOUGHT-AFTER LOCATION WITH EVERYTHING AT YOUR DOORSTEP, INCLUDING KIAMA'S CAFE STRIP, MARKETS AND ROCKPOOL. UNITS ARE RARELY AVAILABLE IN THIS BLOCK SO TAKE ADVANTAGE OF A VENDOR NEEDING A QUICK SALE, CALL MARK AMPHLETT ON 0408 007 558 TO INSPECT NOW.
Property History for 7/29 Minnamurra St, Kiama, NSW 2533
- 13 Jun 2009Listed for Rent - Price not available
- 05 Feb 2009Listed for Rent - Price not available
- 19 Jul 2008Listed for Rent - Price not available
Commute Calculator
Recent sales nearby
See more recent sales nearby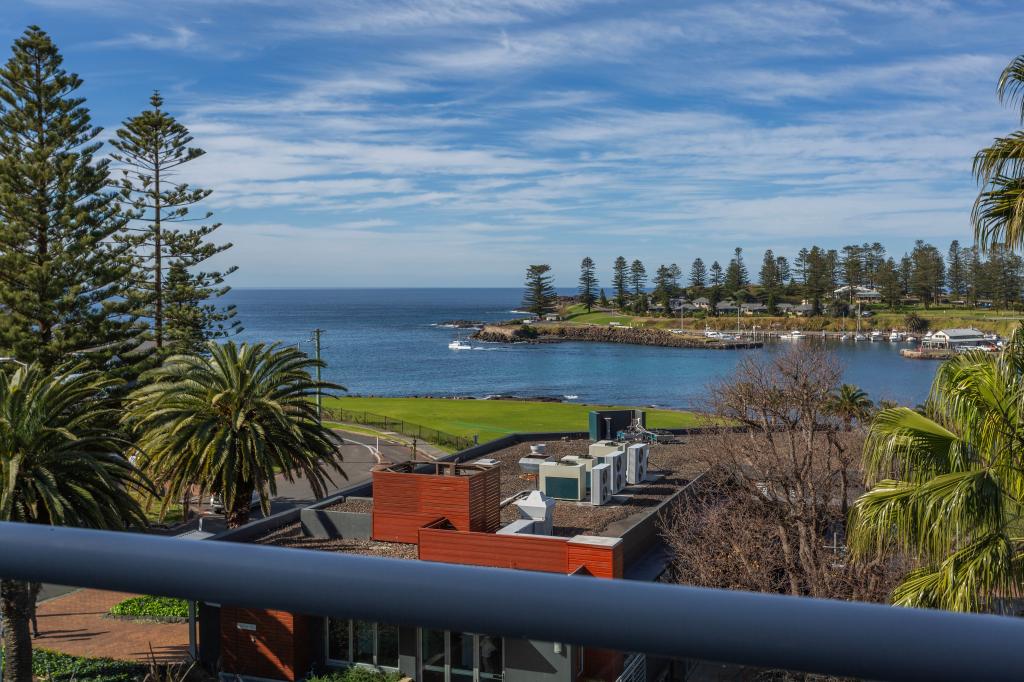 0
0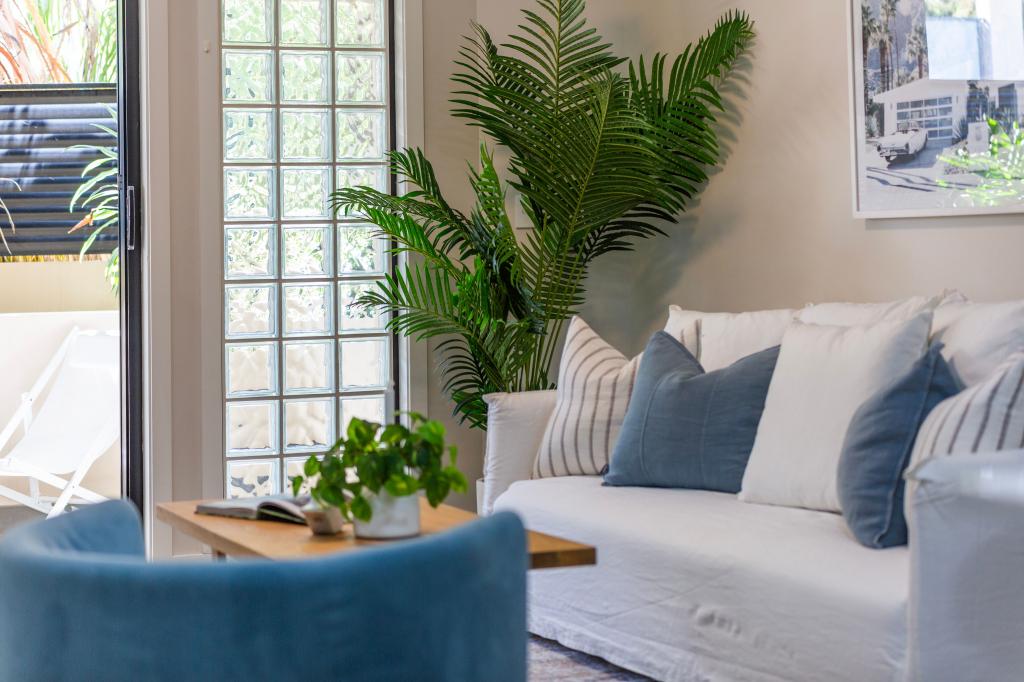 0
0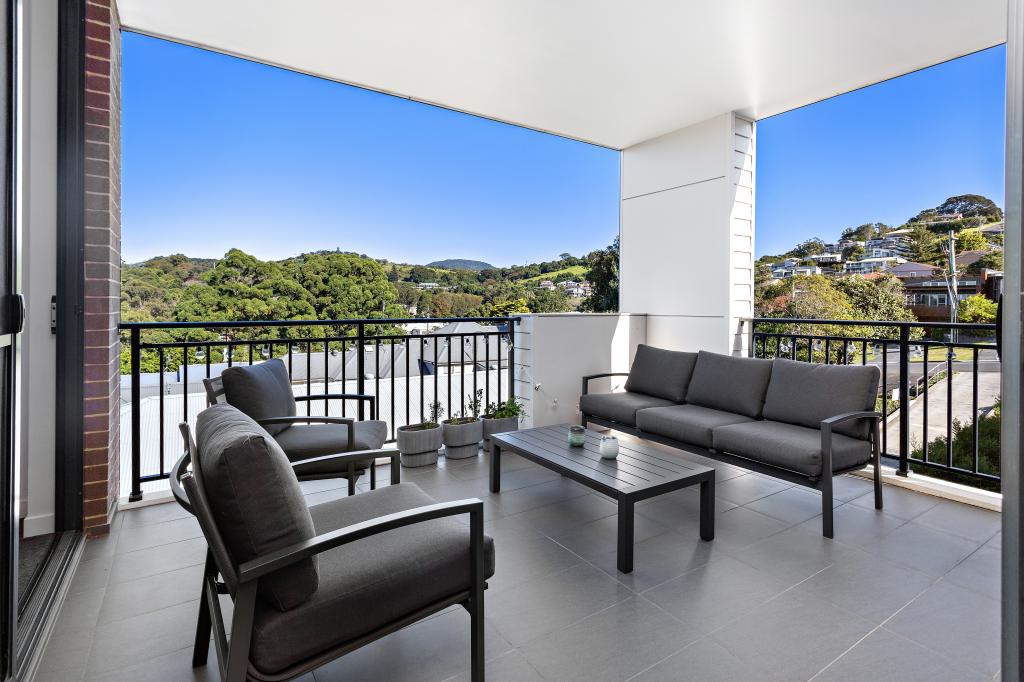 0
0
Similar properties For Sale nearby
See more properties for sale nearby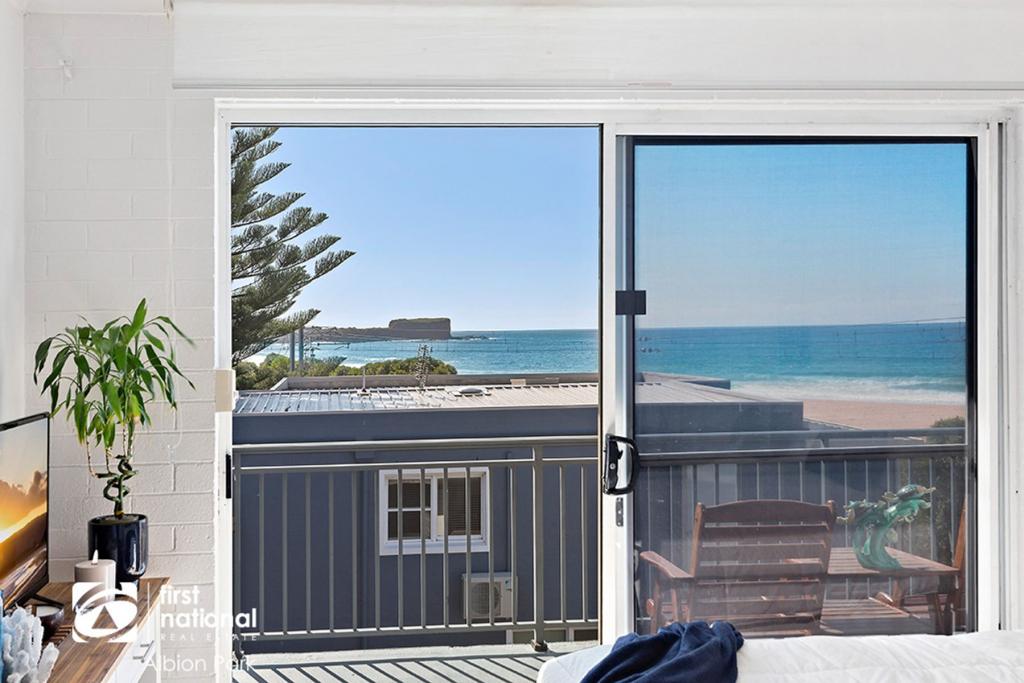 0
0
 0
0

 0
0
Similar properties For Rent nearby
See more properties for rent nearby 0
0 0
0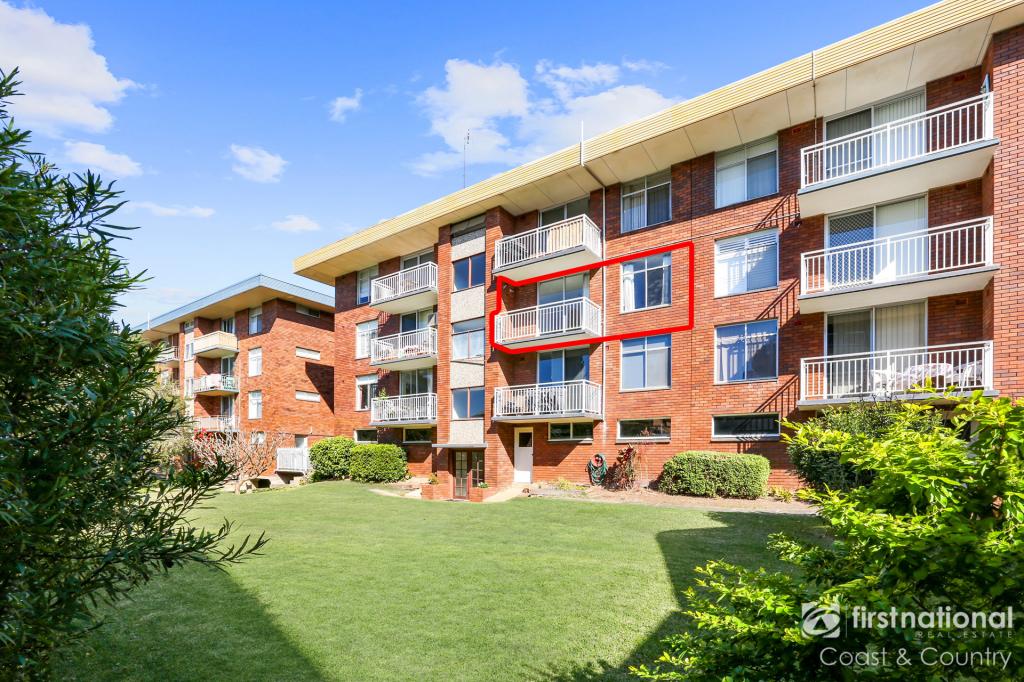 0
0
About Kiama 2533
The size of Kiama is approximately 10 square kilometres. It has 27 parks covering nearly 7.6% of total area. The population of Kiama in 2011 was 6,272 people. By 2016 the population was 6,900 showing a population growth of 10.0% in the area during that time. The predominant age group in Kiama is 60-69 years. Households in Kiama are primarily childless couples and are likely to be repaying $1800 - $2399 per month on mortgage repayments. In general, people in Kiama work in a professional occupation. In 2011, 68.5% of the homes in Kiama were owner-occupied compared with 71.2% in 2016.
Kiama has 5,099 properties. Over the last 5 years, Houses in Kiama have seen a 92.20% increase in median value, while Units have seen a 39.70% increase. As at 31 August 2024:
- The median value for Houses in Kiama is $1,575,205 while the median value for Units is $836,403.
- Houses have a median rent of $685 while Units have a median rent of $600.
Suburb Insights for Kiama 2533
Market Insights
Kiama Trends for Houses
N/A
N/A
View TrendN/A
N/A
Kiama Trends for Units
N/A
N/A
View TrendN/A
N/A
Neighbourhood Insights
© Copyright 2024 RP Data Pty Ltd trading as CoreLogic Asia Pacific (CoreLogic). All rights reserved.
This product uses cookies and other similar technologies to improve and customise your browsing experience, to tailor content and adverts, and for analytics and metrics regarding visitor usage on this product and other media. We may share cookie and analytics information with third parties for the purposes of advertising. By continuing to use our website, you consent to cookies being used. View our Privacy Policy here.
X