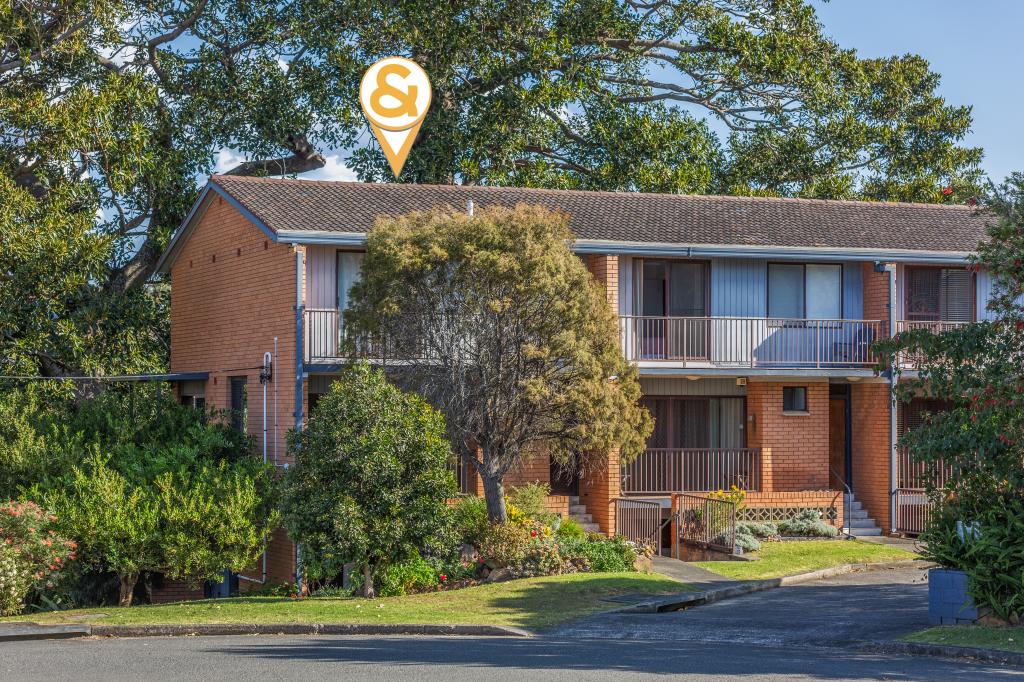
4/119 Manning StreetKiama NSW 2533
Property Details for 4/119 Manning St, Kiama
4/119 Manning St, Kiama is a 3 bedroom, 2 bathroom Townhouse with 2 parking spaces. The property has a land size of 423m2 and floor size of 141m2. While the property is not currently for sale or for rent, it was last sold in February 2018.
Last Listing description (February 2019)
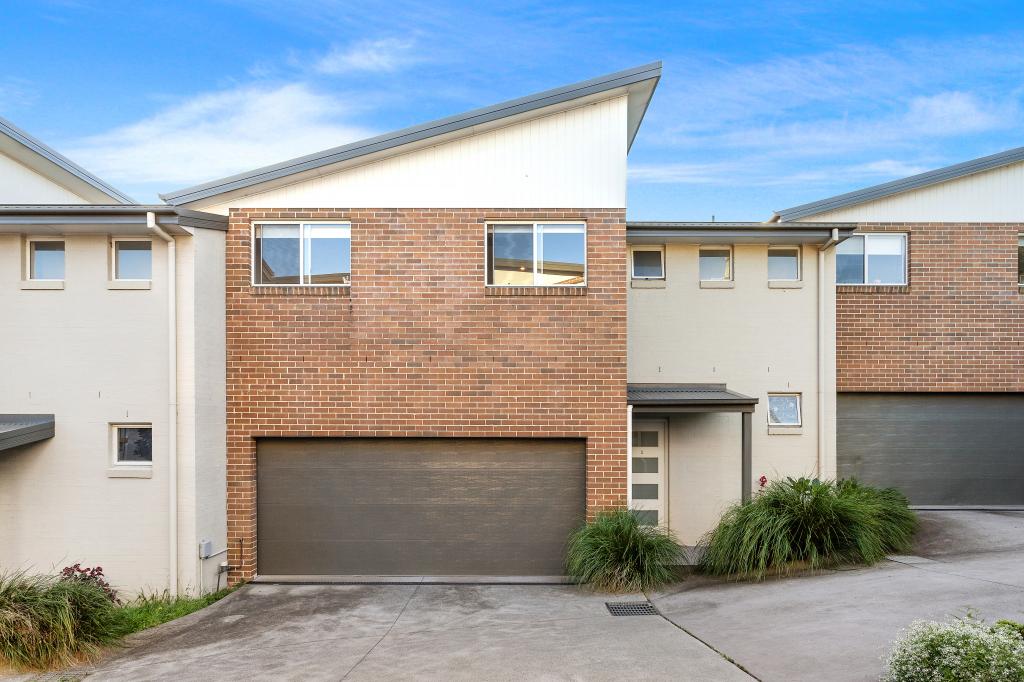
Just when you think you have seen it all, along comes a townhouse that raises the bar in quality and size. An incredible 238m2 in size, it is in impeccable condition. Your feet will be wet at Surf Beach in two minutes, it's that close!
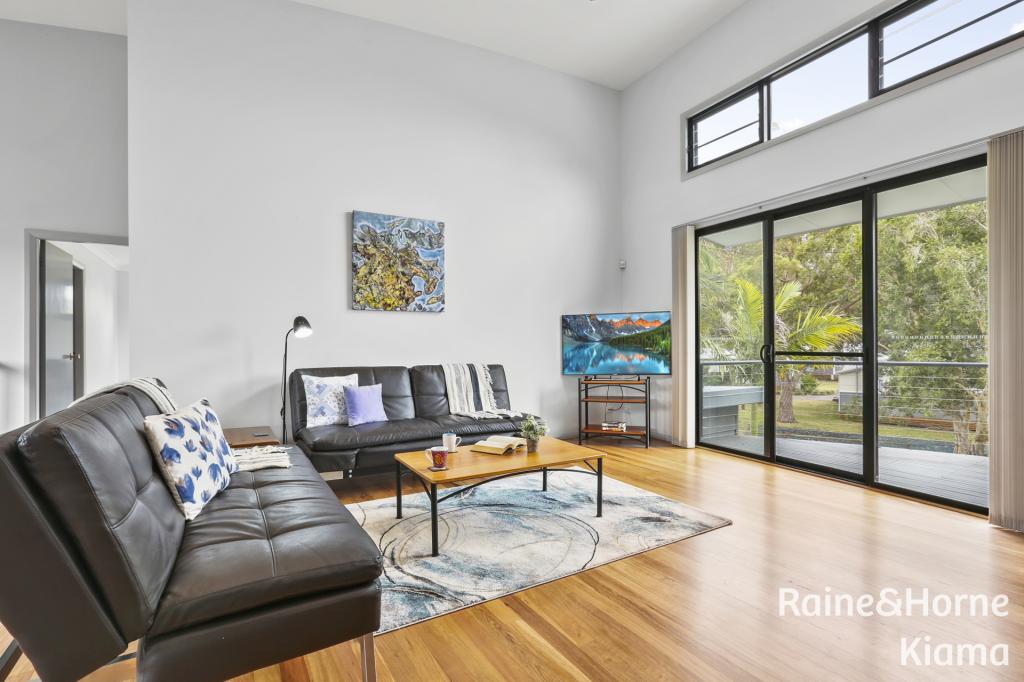
A five minute walk will take you into Kiama's famous caf strip. Incredibly large bedrooms, all with BIW plus a huge walk in robe in the main and an oversized living area mean that space is not an issue. Set at the rear of a very small complex, your privacy is assured.
Entertaining with family and friends is a breeze all year round with the undercover area. Garaging, you guessed it, enormous with plenty of room for all the toys.
Perfect for either the weekender, savvy investor or the professional. Inspections are a must, to appreciate how large and beautiful it is.
Property History for 4/119 Manning St, Kiama, NSW 2533
- 05 Feb 2018Sold for $953,000
- 23 Jan 2018Listed for Sale Just listed
- 22 Feb 2005Sold for $619,000
Commute Calculator
Recent sales nearby
See more recent sales nearby
 0
0
 0
0
Similar properties For Sale nearby
See more properties for sale nearby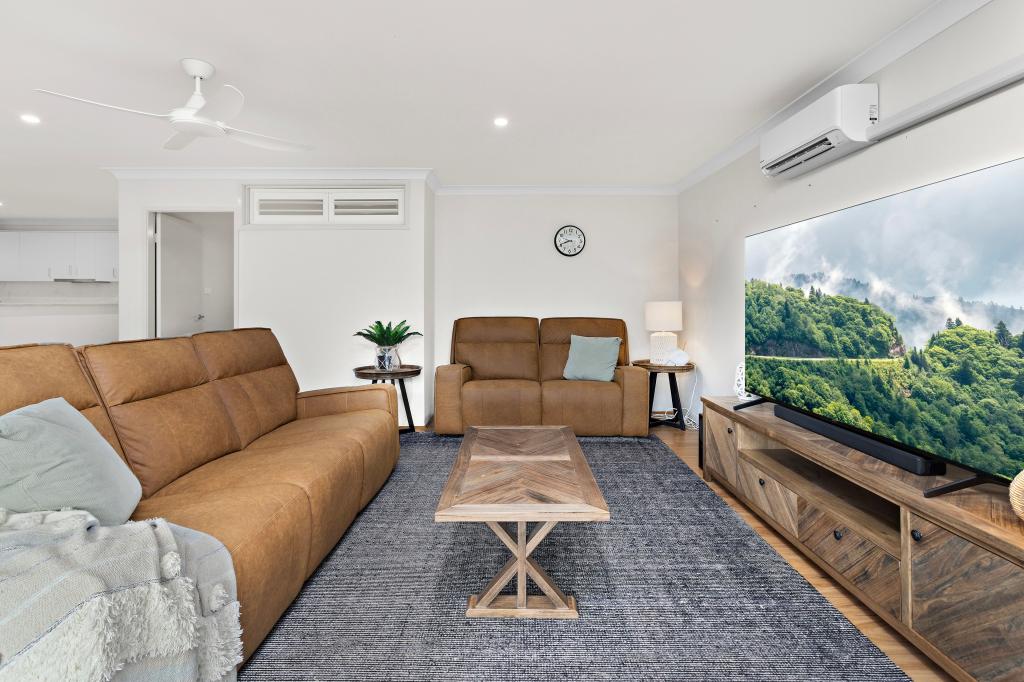 0
0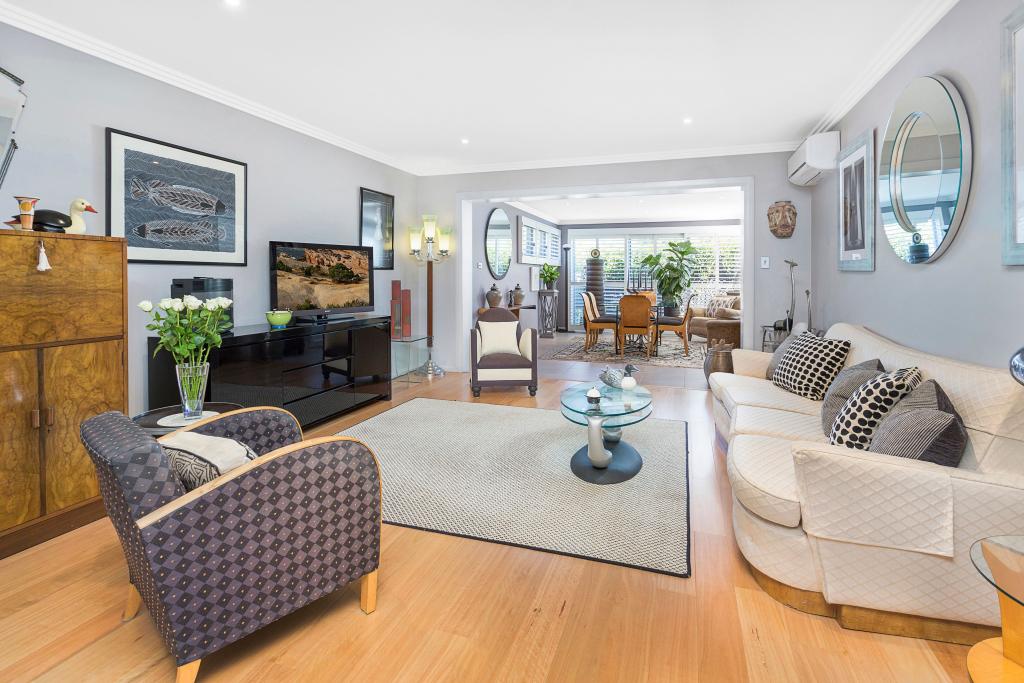 0
0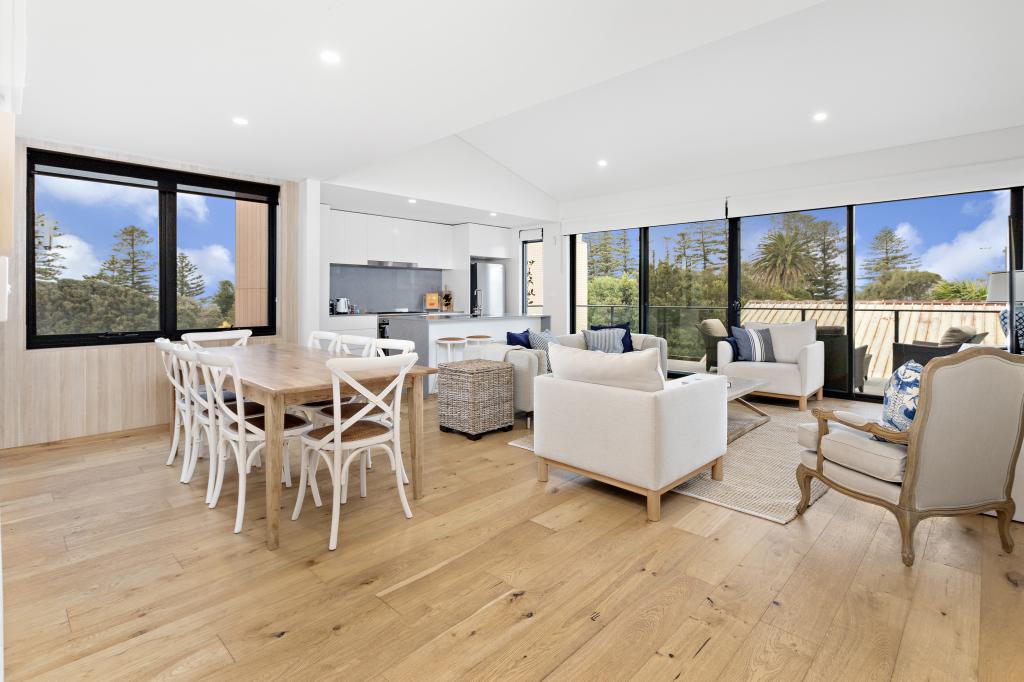 0
0Similar properties For Rent nearby
See more properties for rent nearby
 0
0 0
0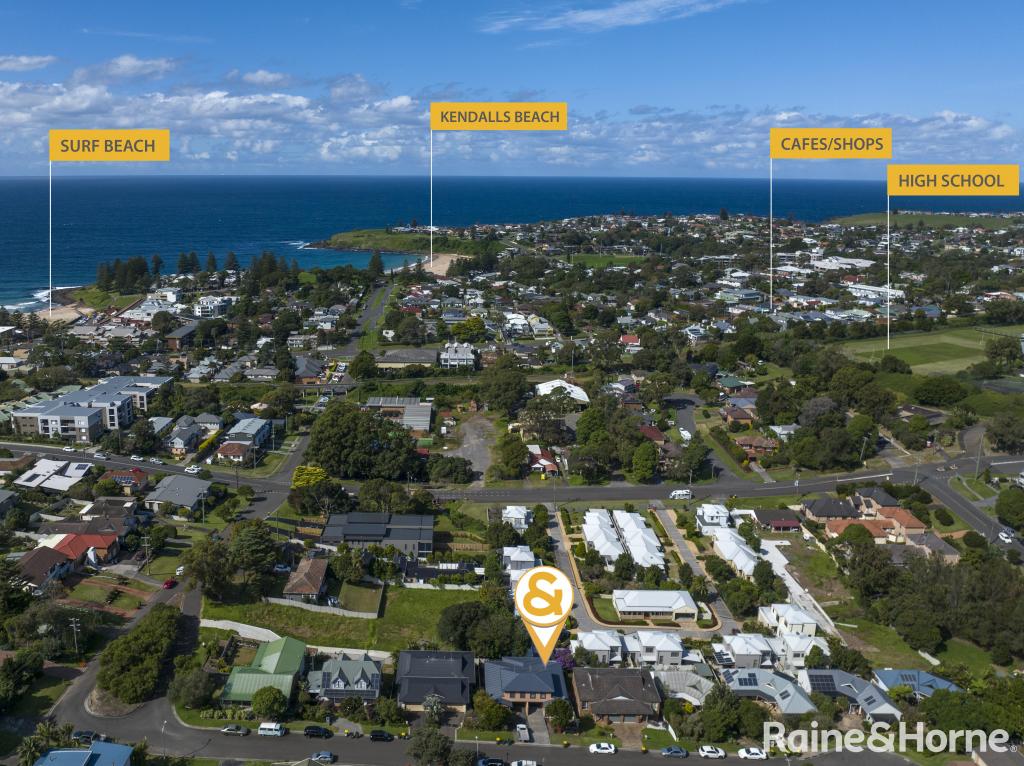 0
0About Kiama 2533
The size of Kiama is approximately 10 square kilometres. It has 27 parks covering nearly 7.6% of total area. The population of Kiama in 2011 was 6,272 people. By 2016 the population was 6,900 showing a population growth of 10.0% in the area during that time. The predominant age group in Kiama is 60-69 years. Households in Kiama are primarily childless couples and are likely to be repaying $1800 - $2399 per month on mortgage repayments. In general, people in Kiama work in a professional occupation. In 2011, 68.5% of the homes in Kiama were owner-occupied compared with 71.2% in 2016.
Kiama has 5,114 properties. Over the last 5 years, Houses in Kiama have seen a 86.46% increase in median value, while Units have seen a 47.94% increase. As at 31 October 2024:
- The median value for Houses in Kiama is $1,592,668 while the median value for Units is $866,577.
- Houses have a median rent of $700 while Units have a median rent of $600.
Suburb Insights for Kiama 2533
Market Insights
Kiama Trends for Houses
N/A
N/A
View TrendN/A
N/A
Kiama Trends for Units
N/A
N/A
View TrendN/A
N/A
Neighbourhood Insights
© Copyright 2024 RP Data Pty Ltd trading as CoreLogic Asia Pacific (CoreLogic). All rights reserved.
This product uses cookies and other similar technologies to improve and customise your browsing experience, to tailor content and adverts, and for analytics and metrics regarding visitor usage on this product and other media. We may share cookie and analytics information with third parties for the purposes of advertising. By continuing to use our website, you consent to cookies being used. View our Privacy Policy here.
X