4/116 Manning StreetKiama NSW 2533
Property Details for 4/116 Manning St, Kiama
4/116 Manning St, Kiama is a 2 bedroom, 1 bathroom Unit with 1 parking spaces and was built in 1995. The property has a land size of 4467m2 and floor size of 83m2. While the property is not currently for sale or for rent, it was last sold in February 2007.
Last Listing description (February 2007)
How close do you want it?
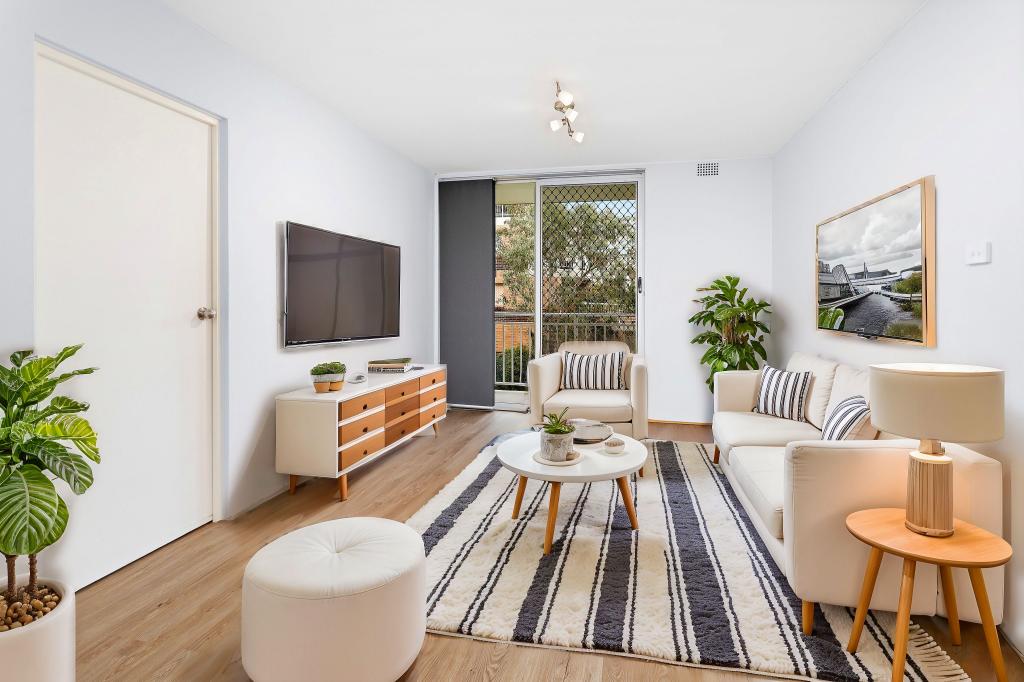
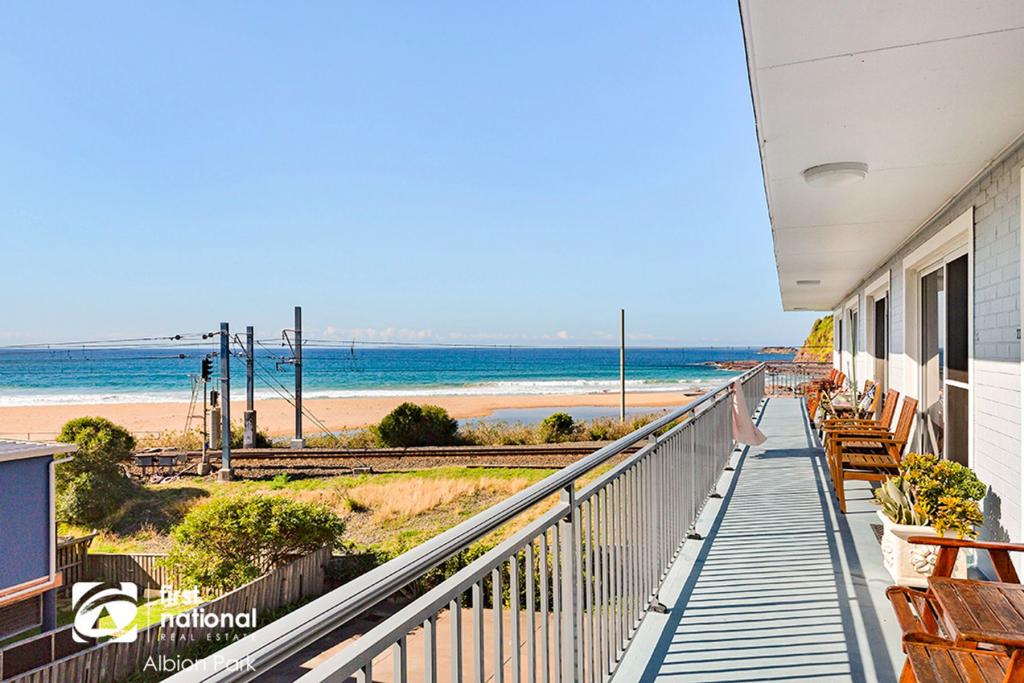
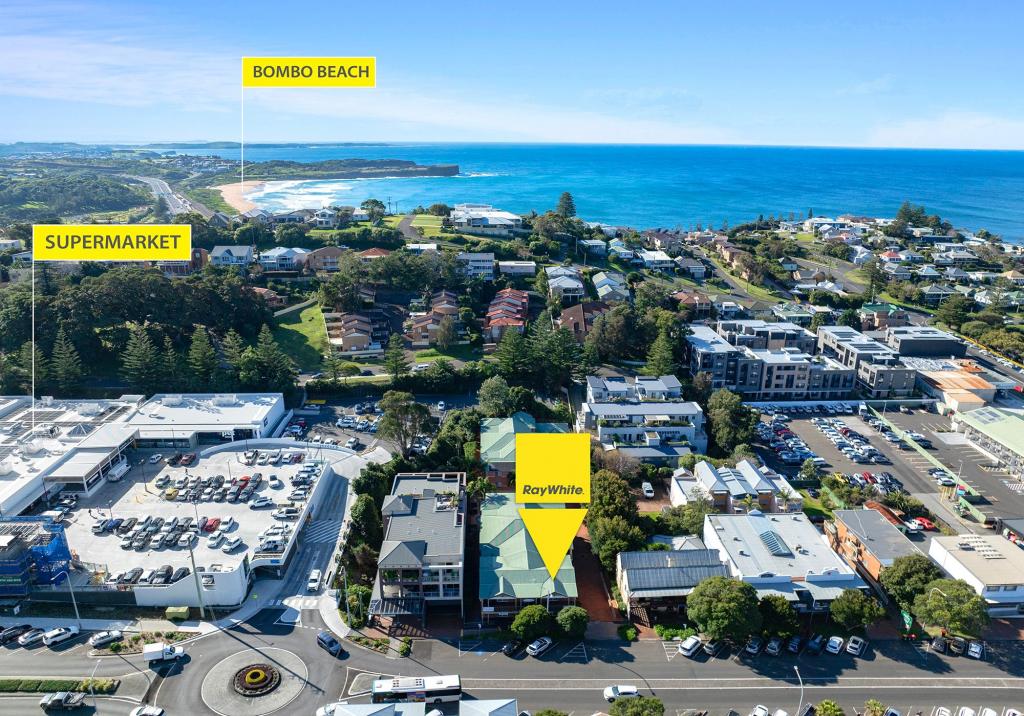
An immaculate 3 bedroom townhouse literally 1 minute from surf beach awaits your inspection. Open plan living, internal access from double garage. A VERY PRIVATE townhouse in an unbelievable location means that you can enjoy all the benefits of Kiama's beaches, cafes and shops that are at your fingertips. Perfect for the retirees or the investor, you will go a long way to find a better value for money t/house.
Property History for 4/116 Manning St, Kiama, NSW 2533
- 29 Mar 2008Listed for Sale Not Disclosed
- 09 Feb 2007Sold for $340,000
- 05 Oct 2006Listed for Sale Not Disclosed
Commute Calculator
Recent sales nearby
See more recent sales nearby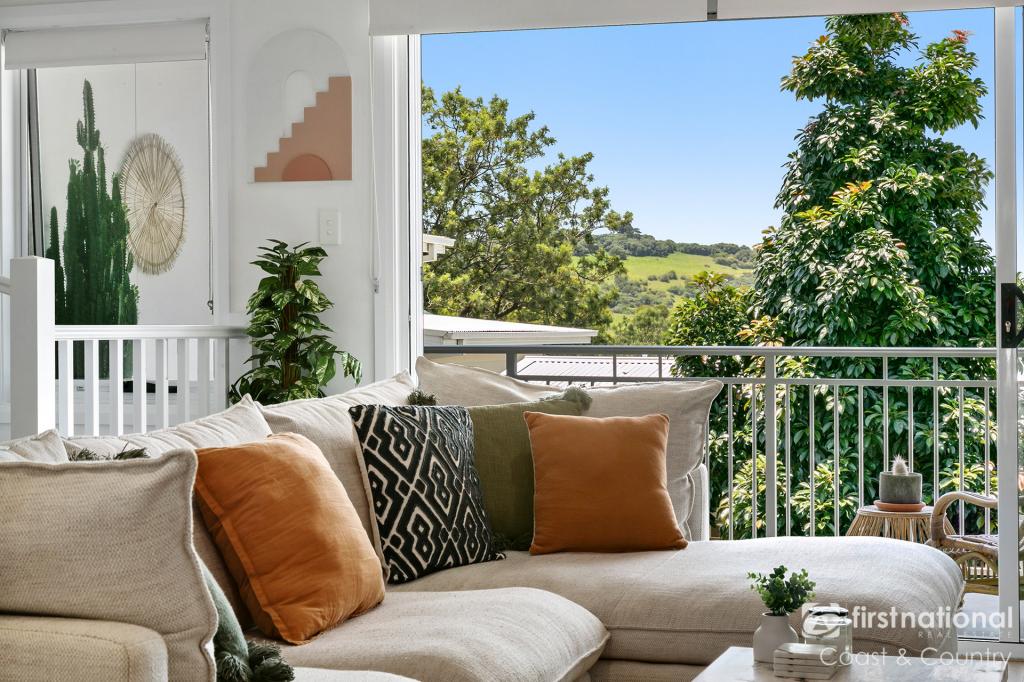 0
0
 0
0Similar properties For Sale nearby
See more properties for sale nearby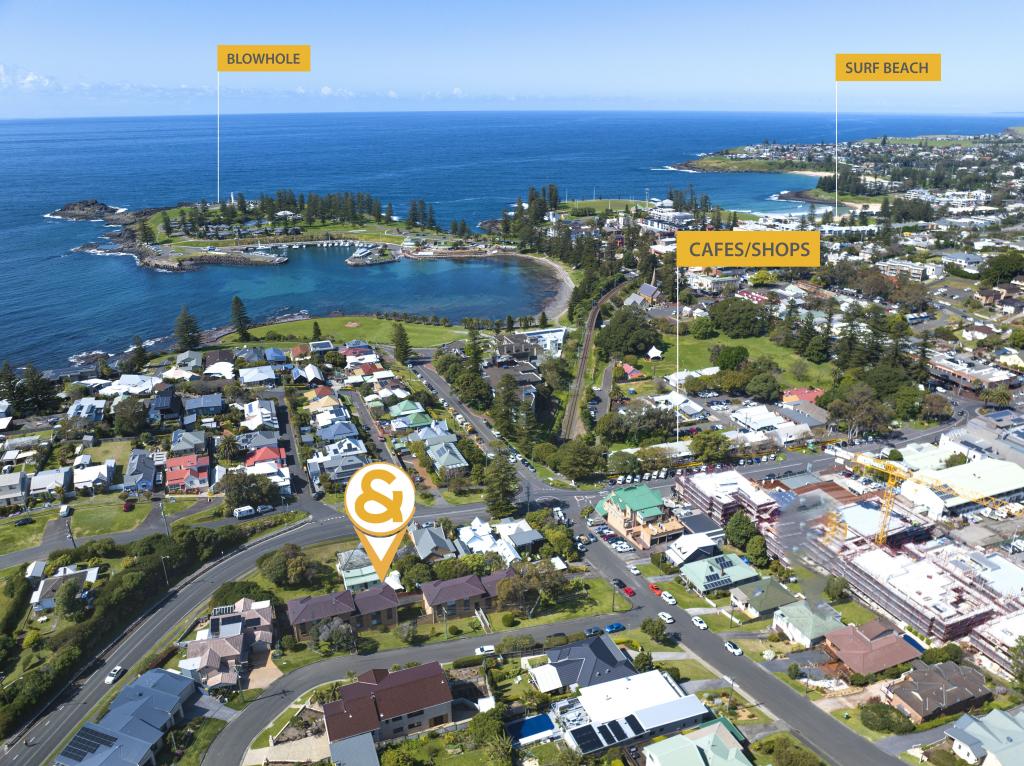 0
0
 0
0
 0
0Similar properties For Rent nearby
See more properties for rent nearby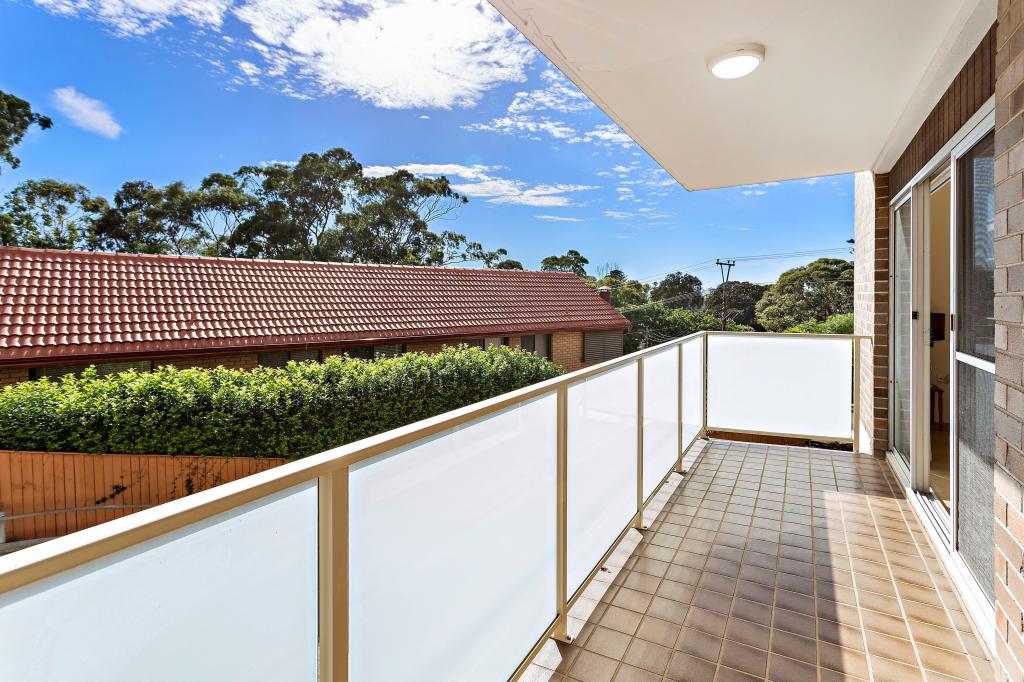 0
0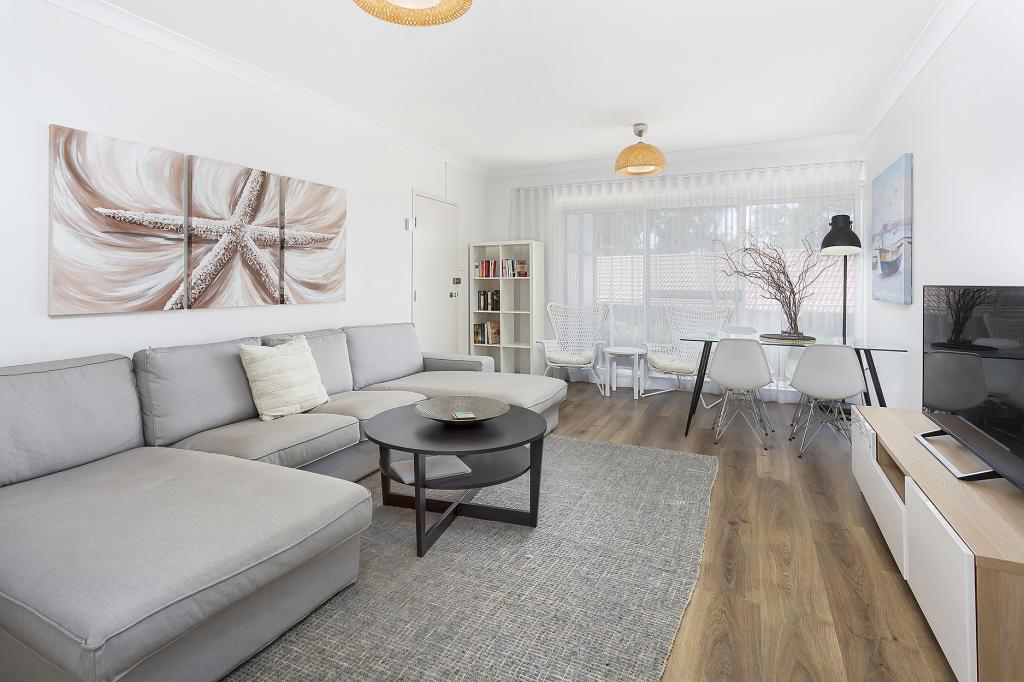 0
0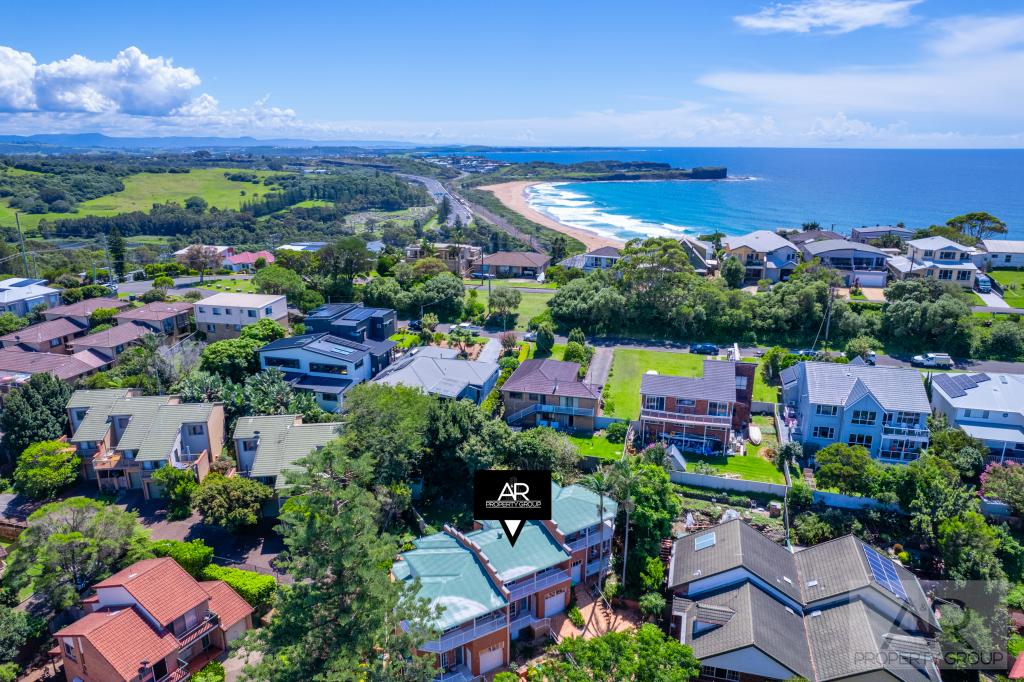 0
0
About Kiama 2533
The size of Kiama is approximately 10 square kilometres. It has 27 parks covering nearly 7.6% of total area. The population of Kiama in 2011 was 6,272 people. By 2016 the population was 6,900 showing a population growth of 10.0% in the area during that time. The predominant age group in Kiama is 60-69 years. Households in Kiama are primarily childless couples and are likely to be repaying $1800 - $2399 per month on mortgage repayments. In general, people in Kiama work in a professional occupation. In 2011, 68.5% of the homes in Kiama were owner-occupied compared with 71.2% in 2016.
Kiama has 5,144 properties. Over the last 5 years, Houses in Kiama have seen a 76.79% increase in median value, while Units have seen a 56.73% increase. As at 31 January 2025:
- The median value for Houses in Kiama is $1,578,647 while the median value for Units is $907,614.
- Houses have a median rent of $730 while Units have a median rent of $620.
Suburb Insights for Kiama 2533
Market Insights
Kiama Trends for Houses
N/A
N/A
View TrendN/A
N/A
Kiama Trends for Units
N/A
N/A
View TrendN/A
N/A
Neighbourhood Insights
© Copyright 2025 RP Data Pty Ltd trading as CoreLogic Asia Pacific (CoreLogic). All rights reserved.
This product uses cookies and other similar technologies to improve and customise your browsing experience, to tailor content and adverts, and for analytics and metrics regarding visitor usage on this product and other media. We may share cookie and analytics information with third parties for the purposes of advertising. By continuing to use our website, you consent to cookies being used. View our Privacy Policy here.
X