98 Oxford RoadIngleburn NSW 2565
Property Details for 98 Oxford Rd, Ingleburn
98 Oxford Rd, Ingleburn is a 3 bedroom, 2 bathroom House with 2 parking spaces and was built in 2016. The property has a land size of 207m2 and floor size of 154m2. While the property is not currently for sale or for rent, it was last sold in May 2016.
Last Listing description (October 2022)
Property Highlights:
} Main with en-suite and walk in robe
} Three double sized bedrooms
} Three modern bathrooms
} State of the art kitchen with gas appliances
} Undercover outdoor area
} Close to schools, shops and transport
FAQ:
} Lease term 6-12 months
} No Pets
For more information please contact Maha on 0435 089 837
[CAPITAL GROUP REAL ESTATE]
Property History for 98 Oxford Rd, Ingleburn, NSW 2565
- 20 Jun 2022Listed for Rent $520 / week
- 02 Nov 2017Listed for Rent - Price not available
- 12 May 2017Listed for Rent - Price not available
Commute Calculator
Recent sales nearby
See more recent sales nearby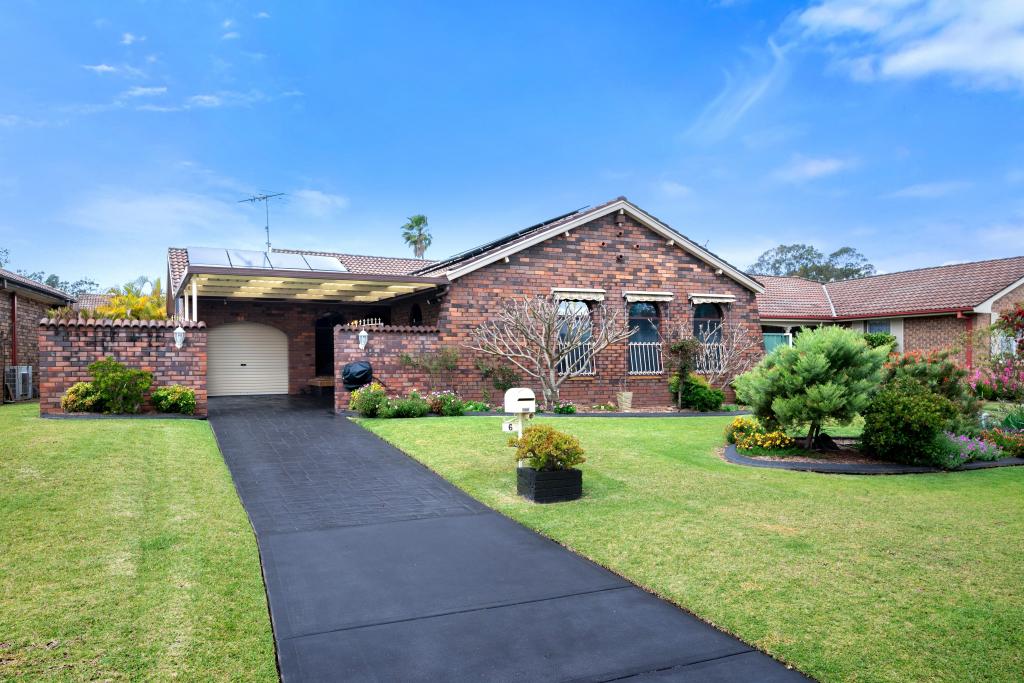 0
0
 0
0Similar properties For Sale nearby
See more properties for sale nearby 0
0 0
0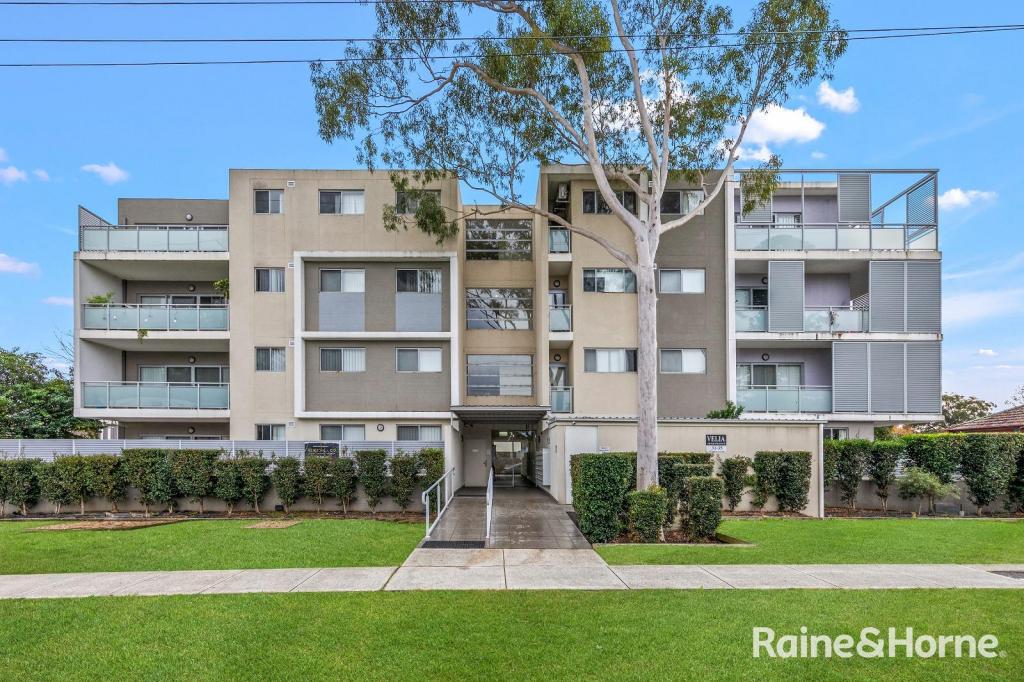 0
0Similar properties For Rent nearby
See more properties for rent nearby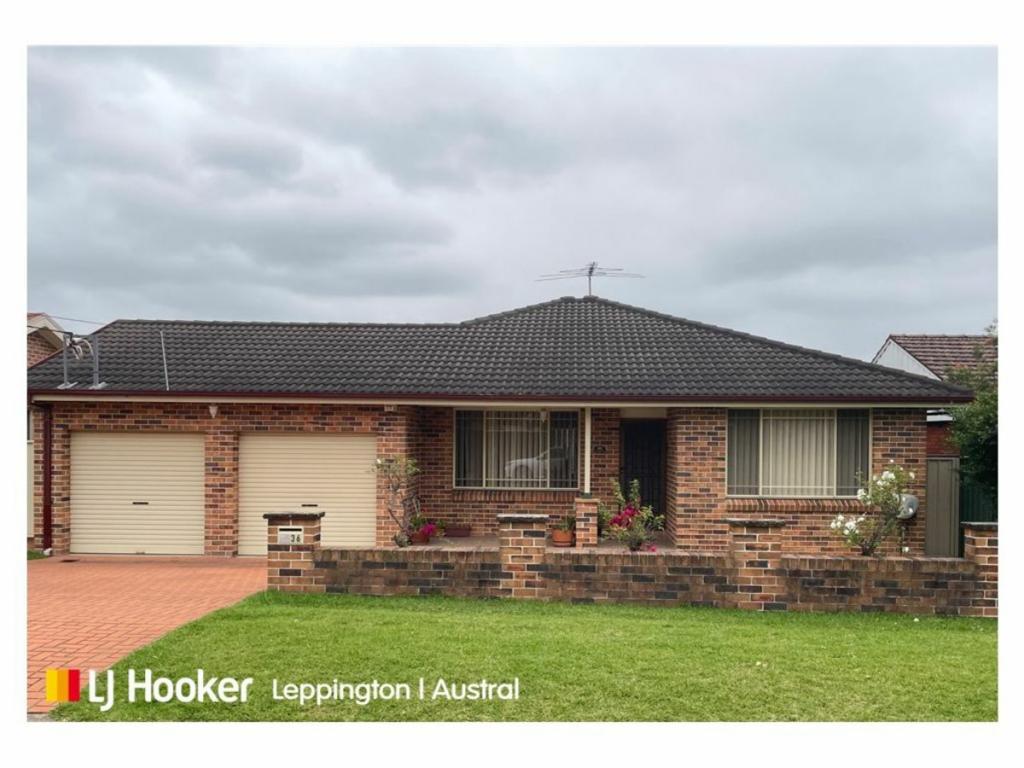 0
0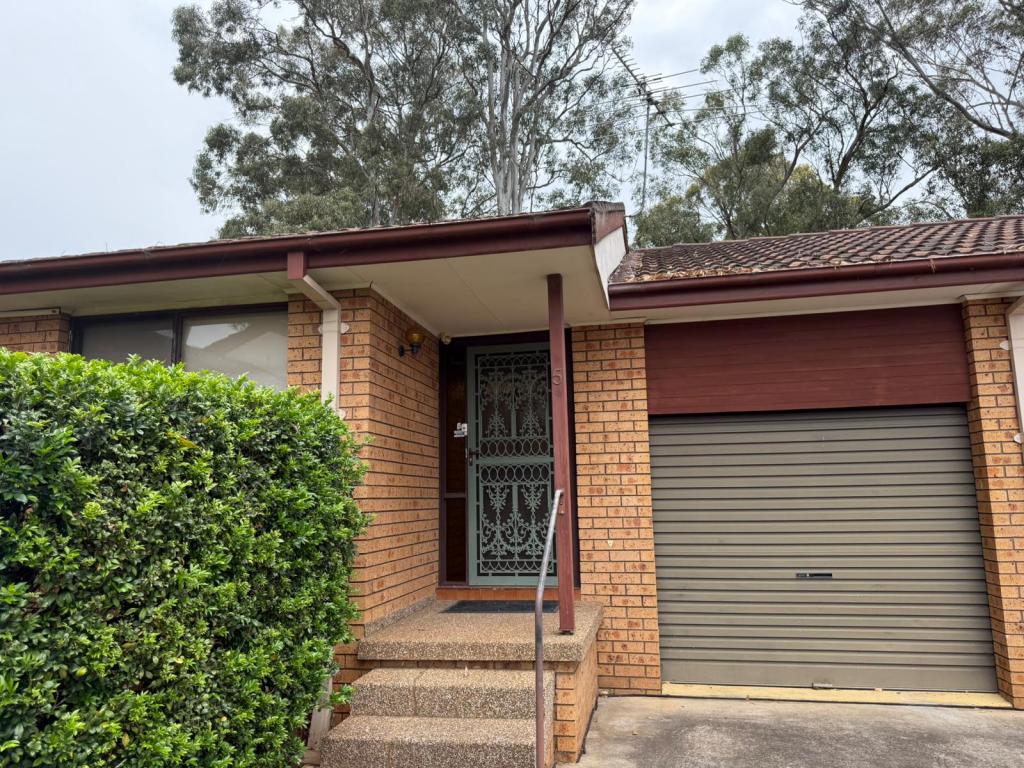 0
0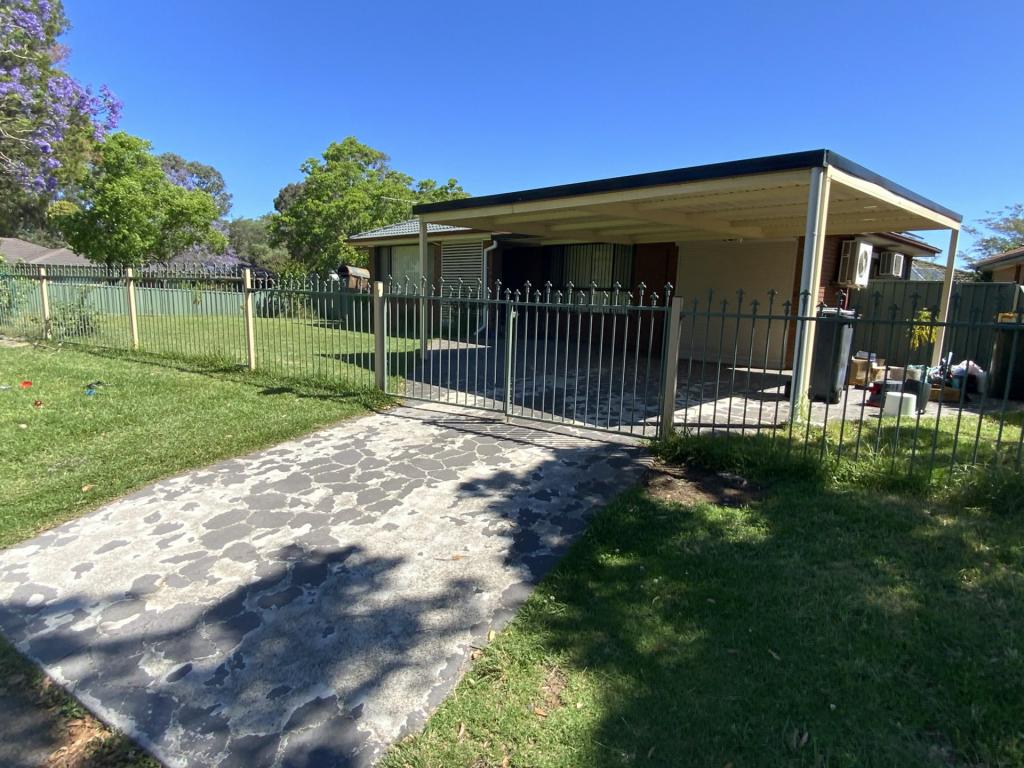 0
0About Ingleburn 2565
The size of Ingleburn is approximately 12.3 square kilometres. It has 23 parks covering nearly 4.7% of total area. The population of Ingleburn in 2011 was 13,902 people. By 2016 the population was 15,055 showing a population growth of 8.3% in the area during that time. The predominant age group in Ingleburn is 30-39 years. Households in Ingleburn are primarily couples with children and are likely to be repaying $1800 - $2399 per month on mortgage repayments. In general, people in Ingleburn work in a clerical occupation. In 2011, 69.4% of the homes in Ingleburn were owner-occupied compared with 65.1% in 2016.
Ingleburn has 7,499 properties. Over the last 5 years, Houses in Ingleburn have seen a 56.58% increase in median value, while Units have seen a 40.02% increase. As at 31 October 2024:
- The median value for Houses in Ingleburn is $980,490 while the median value for Units is $597,293.
- Houses have a median rent of $600 while Units have a median rent of $520.
Suburb Insights for Ingleburn 2565
Market Insights
Ingleburn Trends for Houses
N/A
N/A
View TrendN/A
N/A
Ingleburn Trends for Units
N/A
N/A
View TrendN/A
N/A
Neighbourhood Insights
© Copyright 2024 RP Data Pty Ltd trading as CoreLogic Asia Pacific (CoreLogic). All rights reserved.
This product uses cookies and other similar technologies to improve and customise your browsing experience, to tailor content and adverts, and for analytics and metrics regarding visitor usage on this product and other media. We may share cookie and analytics information with third parties for the purposes of advertising. By continuing to use our website, you consent to cookies being used. View our Privacy Policy here.
X