2/63A Burns Street, Hillston, NSW 2675 | Property Value & History | OnTheHouse
OFF MARKET
Are you the owner?

2/63A Burns Street
Hillston NSW 2675

Bedrooms: 2
Bathrooms: 1
Car spaces: -
Land area: 2024m2
Estimated Value & Rent
Estimated Value
Estimated Rent
Low Confidence
Last updated 7 Apr 2025
Low

High
$350k
$375k
Save

Property Details for 2/63a Burns St, Hillston

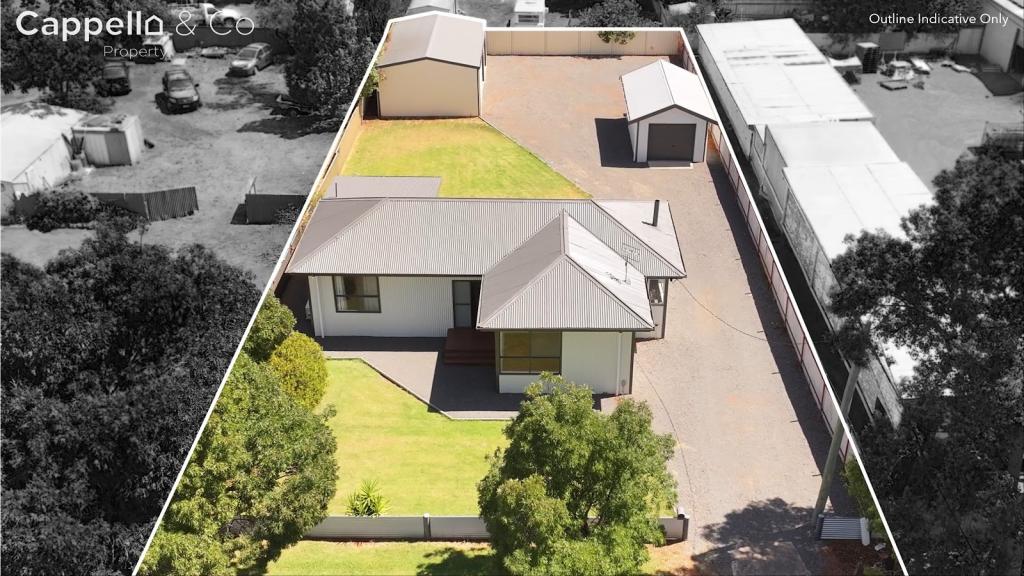
2/63a Burns St, Hillston is a 2 bedroom, 1 bathroom Unit. The property has a land size of 2024m2.

Building Type
Unit
Land Size
2024m2
Local Government
Carrathool

Last Listing description (February 2022)

Located on Burns Street Hillston this two bedroom unit features the following:
- Partly furnished
- Free Wifi

- Free water
- Spacious living room
- Small easy to maintain backyard
- Single carport
- Storage room
Enquire today or contact Lara at Nutrien Harcourts on 02 6962 1811.

Property History for 2/63a Burns St, Hillston, NSW 2675

A timeline of how this property has performed in the market
Listed for Rent
$270/w
17 Dec 2021
  • 17 Dec 2021
    Listed for Rent $270 / week
  • 08 Oct 2018
    Listed for Rent - Price not available

Commute Calculator

Where to?
-
-
-
-

About Hillston 2675

The size of Hillston is approximately 3,988 square kilometres. It has 7 parks covering nearly 9.9% of total area. The population of Hillston in 2011 was 1,430 people. By 2016 the population was 1,467 showing a population growth of 2.6% in the area during that time. The predominant age group in Hillston is 40-49 years. Households in Hillston are primarily childless couples and are likely to be repaying $1000 - $1399 per month on mortgage repayments. In general, people in Hillston work in a managers occupation. In 2011, 62.7% of the homes in Hillston were owner-occupied compared with 56% in 2016.

Hillston has 1,073 properties. Over the last 5 years, Houses in Hillston have seen a 103.87% increase in median value. As at 31 March 2025:

  • The median value for Houses in Hillston is $249,121 while the median value for Units is $364,294.
  • Houses have a median rent of $350.
There are currently 2 properties listed for sale, and no properties listed for rent in Hillston on OnTheHouse. According to CoreLogic's data, 35 properties were sold in the past 12 months in Hillston.

What's around 2/63a Burns St, Hillston

2/63a Burns St, Hillston is in the school catchment zone for Hillston Central School.

Nearby Schools
Comparable Properties
Hillston Central School
0.24km
Hillston 2675
IN CATCHMENTCombinedGovernmentP - 12Combined164 Enrolled
Goolgowi Public School
56.86km
Goolgowi 2652
PrimaryGovernmentP - 6Combined45 Enrolled
Booligal Public School
73.61km
Booligal 2711
PrimaryGovernmentP - 6Combined7 Enrolled
Naradhan Public School
74.45km
Naradhan 2669
PrimaryGovernmentP - 6Combined13 Enrolled
Rankins Springs Public School
77.43km
Rankins Springs 2669
PrimaryGovernmentP - 6Combined25 Enrolled
St Francis Xavier Primary School
79.57km
Lake Cargelligo 2672
PrimaryNon-GovernmentP - 6Combined393 Enrolled
St Francis Xavier Primary School
79.57km
Lake Cargelligo 2672
PrimaryNon-GovernmentP - 6Combined247 Enrolled
Lake Cargelligo Central School
80.02km
Lake Cargelligo 2672
CombinedGovernmentP - 12Combined246 Enrolled
Euabalong West Public School
92.37km
Euabalong West 2877
PrimaryGovernmentP - 6Combined21 Enrolled
Tharbogang Public School
95.49km
Tharbogang 2680
PrimaryGovernmentP - 6Combined36 Enrolled

Suburb Insights for Hillston 2675

Market Insights
Hillston Trends for Houses
Median Value

$249k

6.70%
View Trend
Median Growth

-5.72%

View Trend
Median Rent

N/A

-
View Trend
Rental Yield

N/A

-
View Trend
Median Value: The middle value of all properties across the geography based on the Automated Valuation Model.


Median Value over 1 year (04/24 - 03/25)
Hillston Trends for Units
Median Value

$364k

11.52%
View Trend
Median Growth

N/A

View Trend
Median Rent

N/A

-
View Trend
Rental Yield

4.59%

11.95%
View Trend
Median Value: The middle value of all properties across the geography based on the Automated Valuation Model.


Median Value over 1 year (04/24 - 03/25)
Neighbourhood Insights
Age

Population 1,467

0-9


12%

10-19


13%

20-29


14%

30-39


12%

40-49


15%

50-59


13%

60-69


9%

70-79


7%

80-89


5%

90-99


1%

Household Structure
Occupancy
Disclaimer
Whilst all reasonable effort is made to ensure the information in this publication is current, CoreLogic does not warrant the accuracy or completeness of the data and information contained in this publication and to the full extent not prohibited by law excludes all liability for any loss or damage arising in connection with the data and information contained in this publication.
New South Wales data
Contains property sales information provided under licence from the Valuer General New South Wales. RP Data Pty Ltd trading as CoreLogic Asia Pacific is authorised as a Property Sales Information provider by the Valuer General New South Wales.
Valuations and Estimates
School data and Content
ABS data
Liveability information
The Liveability Score is a rating (out of 10) provided by Propella.ai Pty Ltd as a guide about how "well-connected" properties are in certain local areas. The Liveability Score is based on statistical data about a local area in which a property is located including the distance to and number of available facilities and services (including schools, parklands, health services, shopping and public transport) (Liveability Data). The Liveability Data and Liveability Score has not been verified or confirmed by CoreLogic, is not available for all properties, and is of a general nature and should not be construed as specific advice or relied upon in lieu of appropriate professional advice. Given the relative nature of the Liveability Score, propella.ai anticipate that scores for individual properties will change over time.