9/19 Dick StreetHenley NSW 2111
Property Details for 9/19 Dick St, Henley
9/19 Dick St, Henley is a 2 bedroom, 1 bathroom Unit with 1 parking spaces and was built in 1966. The property has a land size of 1139m2 and floor size of 71m2. While the property is not currently for sale or for rent, it was last sold in November 1999.
Last Listing description (November 2022)
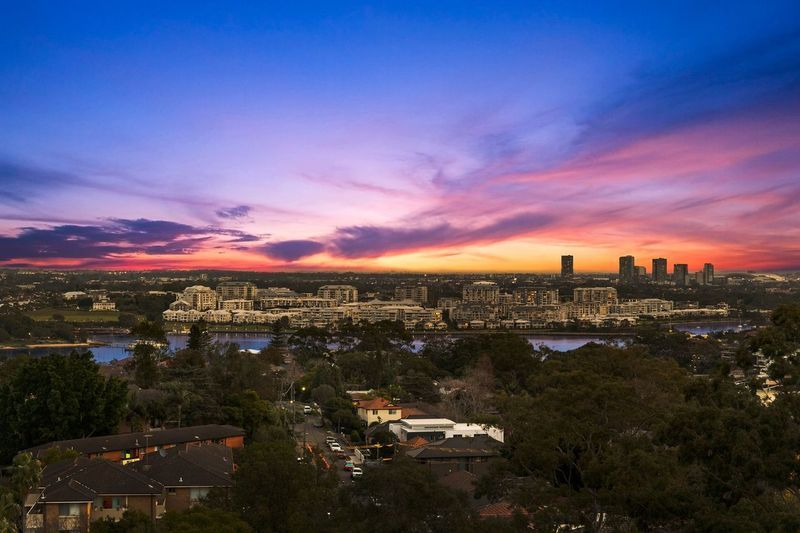
This second floor apartment is in a small water front block and has a leafy outlook and water glimpses. Close to the ferry and access to city buses.
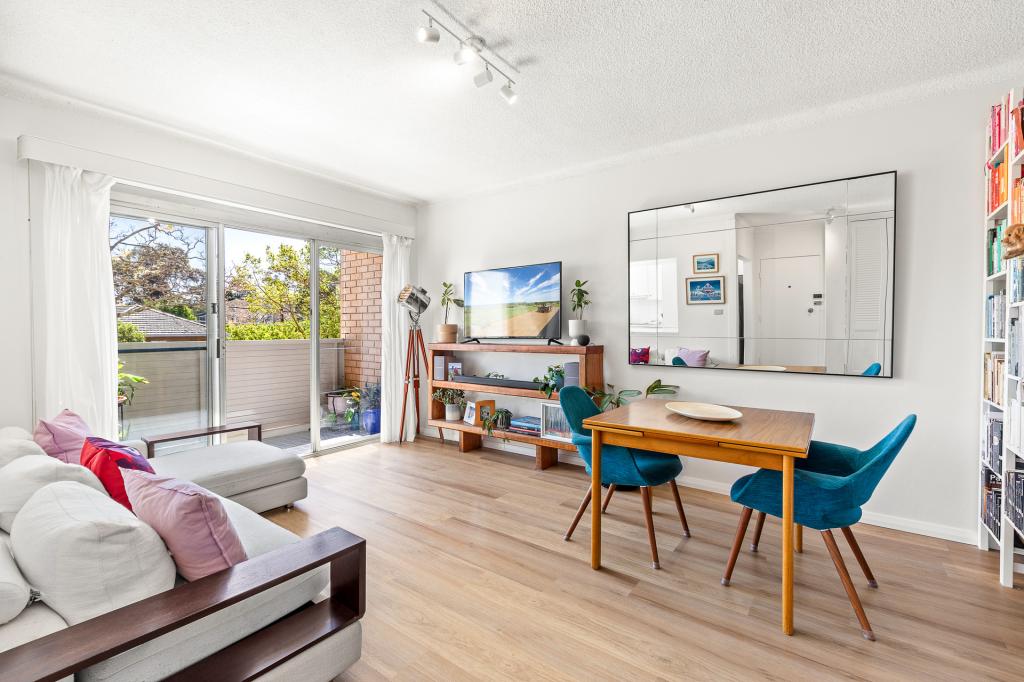
- Two decent sized bedrooms with large windows and water glimpses
- Light and bright on the second floor of a secure block
- Updated bathroom with separate shower recess
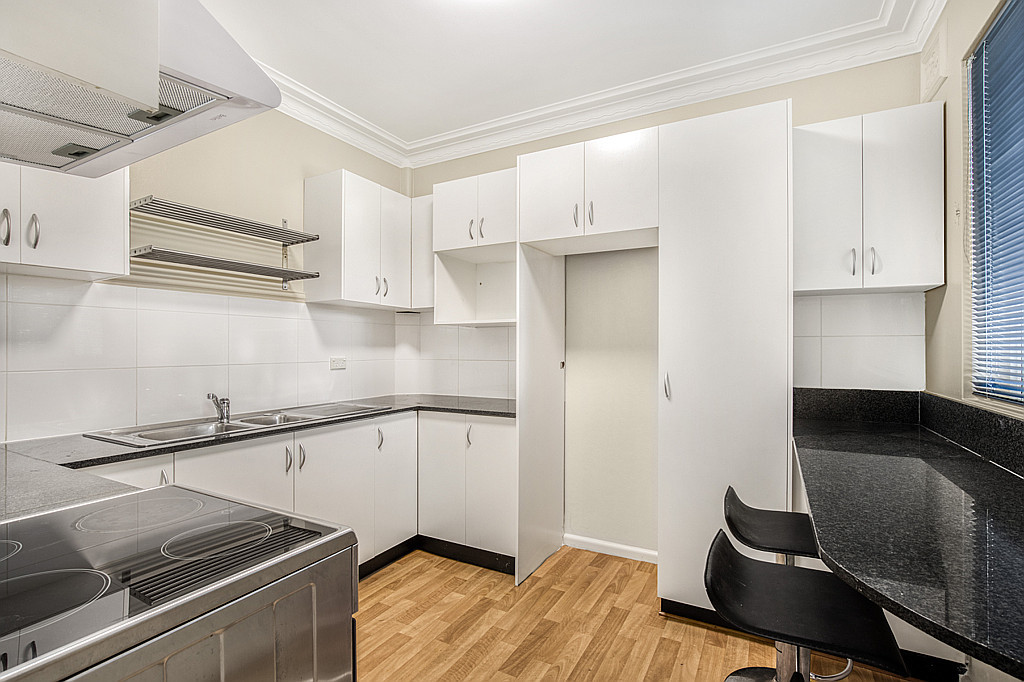
- Internal laundry off kitchen with extra storage
- An easy walk to ferry and city buses
- Plenty of street parking, no permits needed
- Lock up garage, peaceful and quiet
Property History for 9/19 Dick St, Henley, NSW 2111
- 24 Oct 2022Listed for Rent $600 / week
- 01 Apr 2022Listed for Rent $600 / week
- 07 Mar 2014Listed for Rent - Price not available
Commute Calculator
Recent sales nearby
See more recent sales nearby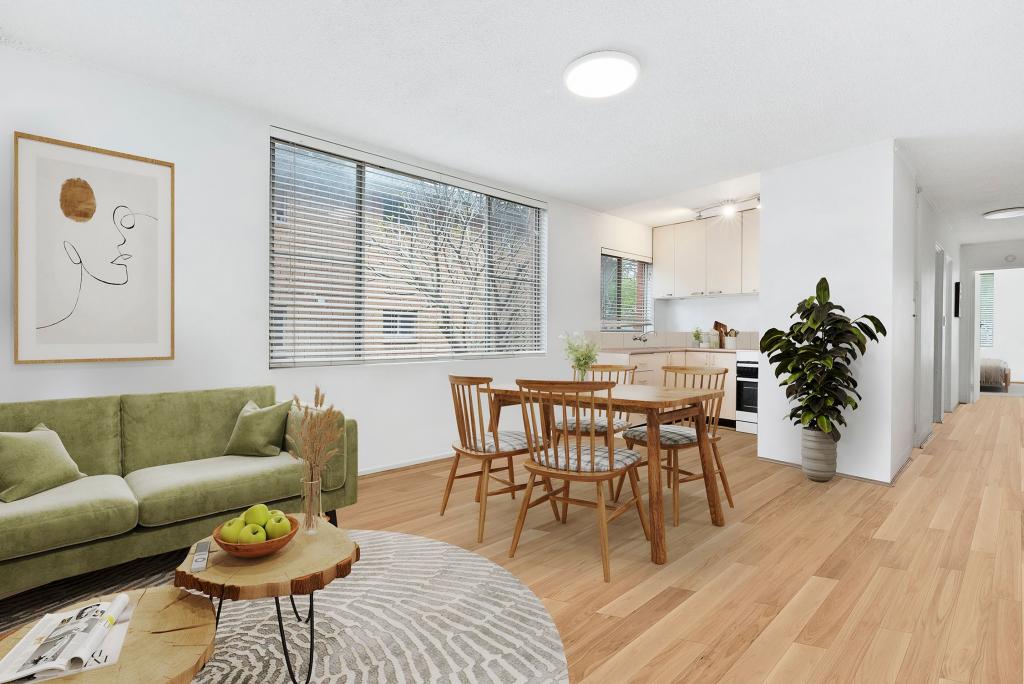 0
0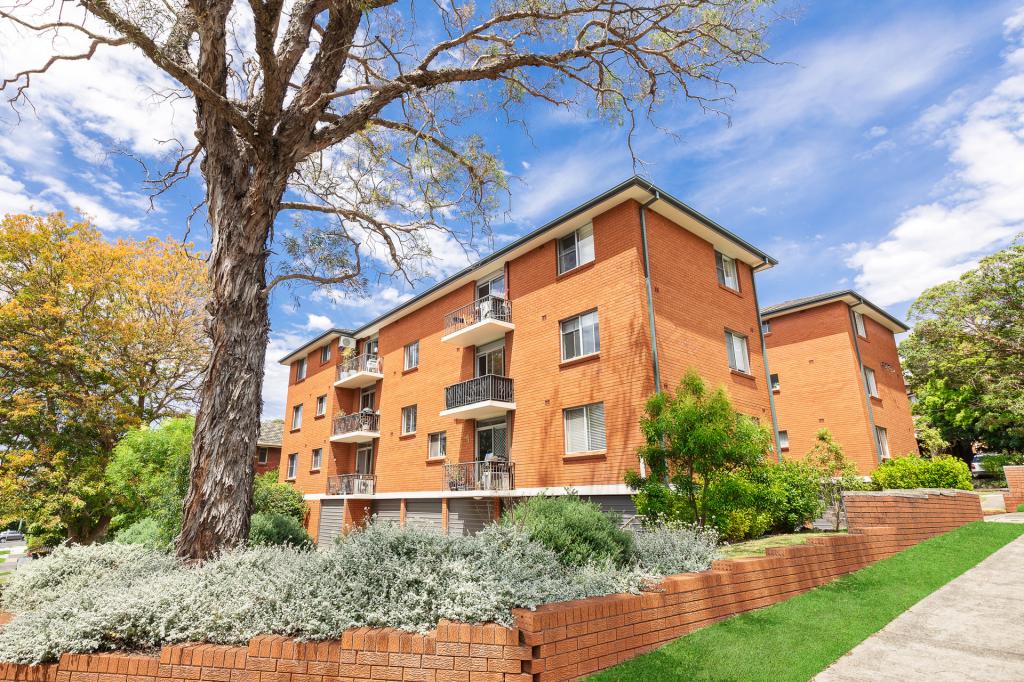 0
0
 0
0
Similar properties For Sale nearby
See more properties for sale nearby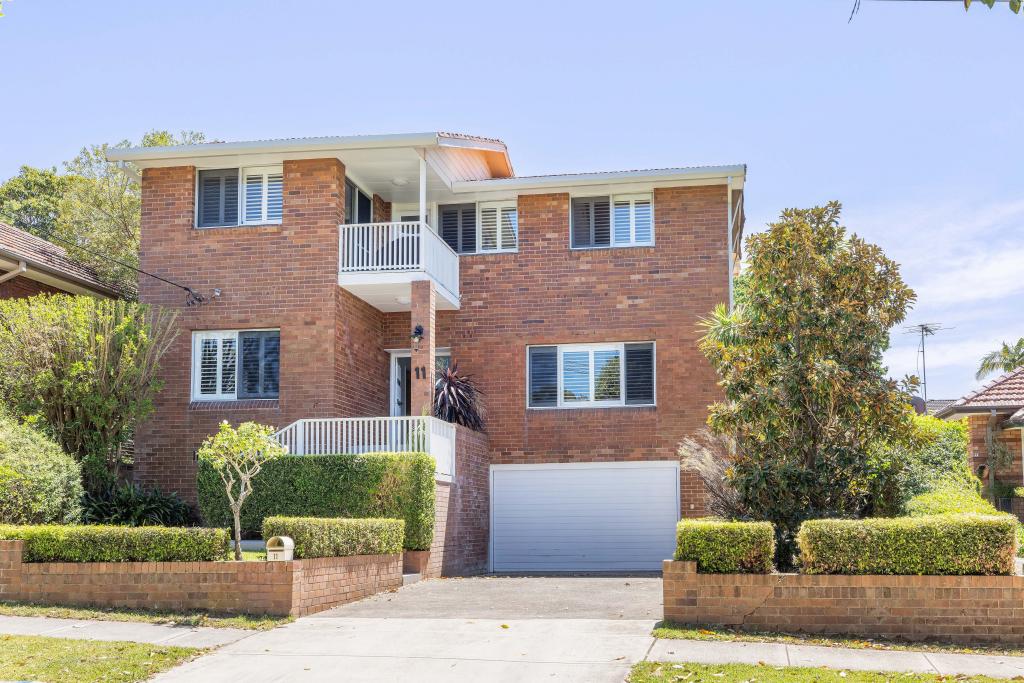 0
0 0
0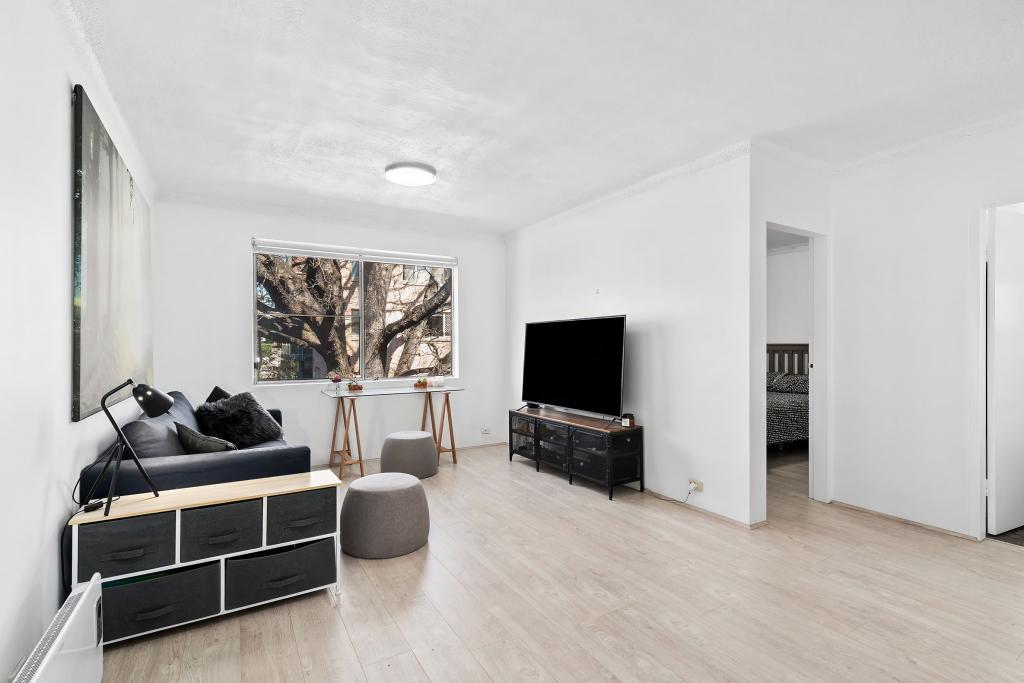 0
0Similar properties For Rent nearby
See more properties for rent nearby
 0
0
 0
0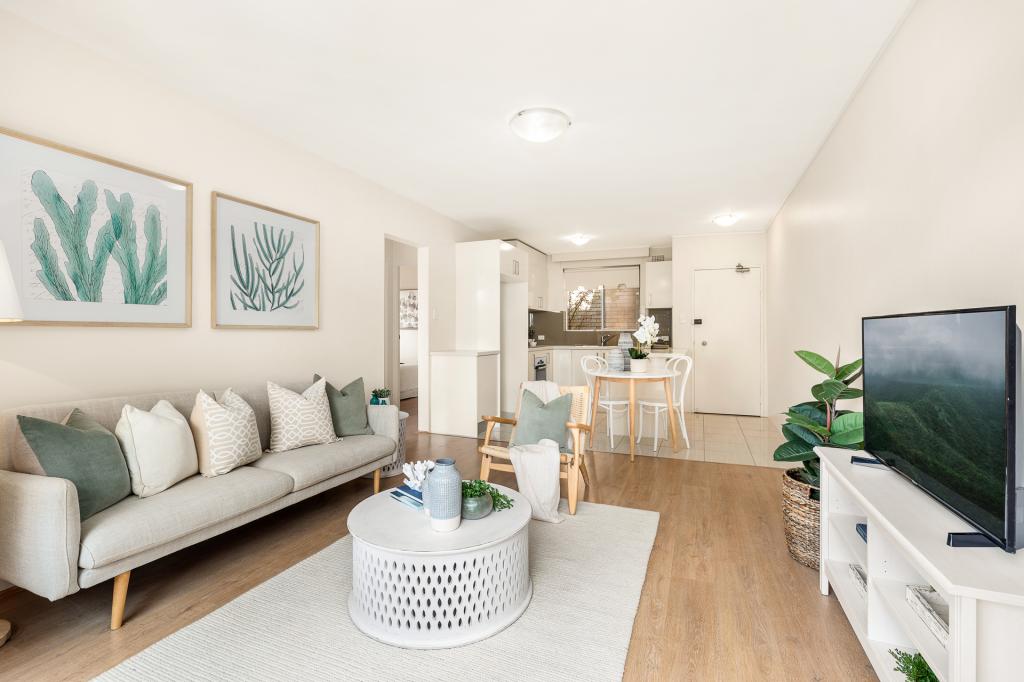 0
0About Henley 2111
The size of Henley is approximately 0.3 square kilometres. It has 2 parks covering nearly 33.5% of total area. The population of Henley in 2011 was 465 people. By 2016 the population was 479 showing a population growth of 3.0% in the area during that time. The predominant age group in Henley is 10-19 years. Households in Henley are primarily couples with children and are likely to be repaying over $4000 per month on mortgage repayments. In general, people in Henley work in a professional occupation. In 2011, 82.9% of the homes in Henley were owner-occupied compared with 79.1% in 2016.
Henley has 198 properties. Over the last 5 years, Houses in Henley have seen a 57.93% increase in median value, while Units have seen a 23.92% increase. As at 31 October 2024:
- The median value for Houses in Henley is $4,621,379 while the median value for Units is $1,595,336.
Suburb Insights for Henley 2111
Market Insights
Henley Trends for Houses
N/A
N/A
View TrendN/A
N/A
Henley Trends for Units
N/A
N/A
View TrendN/A
N/A
Neighbourhood Insights
© Copyright 2024 RP Data Pty Ltd trading as CoreLogic Asia Pacific (CoreLogic). All rights reserved.
This product uses cookies and other similar technologies to improve and customise your browsing experience, to tailor content and adverts, and for analytics and metrics regarding visitor usage on this product and other media. We may share cookie and analytics information with third parties for the purposes of advertising. By continuing to use our website, you consent to cookies being used. View our Privacy Policy here.
X