19 Crown StreetHenley NSW 2111
Property Details for 19 Crown St, Henley
19 Crown St, Henley is a 4 bedroom, 2 bathroom House with 2 parking spaces and was built in 1920. The property has a land size of 876m2 and floor size of 193m2. While the property is not currently for sale or for rent, it was last sold in November 2016.
Last Listing description (December 2016)
With a blend of federation/contemporary architecture, this residence is a family home with soul. On a tightly-held Henley peninsula within the Hunters Hill primary school catchment, its a short walk to the city bus & River Cat.
Highlights
* High side of street, water/city glimpses
* Vaulted ceilings, natural light, fireplace
* Stone kitchen with Euro gas appliances
* Level lawns, poolside entertaining area
* Wood-fired pizza oven & garden sheds
* Green-fringed allotment, 854 sqm land
* Walk-in pantry, master with study + attic
* 2 full bathrooms, main tub, sep. laundry
* Further extend/renovate(subject to council)
Property History for 19 Crown St, Henley, NSW 2111
- 05 Nov 2016Sold for $2,900,000
- 18 Oct 2016Listed for Sale Buyers guide $2,750,000
- 02 Mar 2016Listed for Sale TENDER CLOSING 10/7/16 $2.85M - $3.13M
Commute Calculator
Recent sales nearby
See more recent sales nearbySimilar properties For Sale nearby
See more properties for sale nearby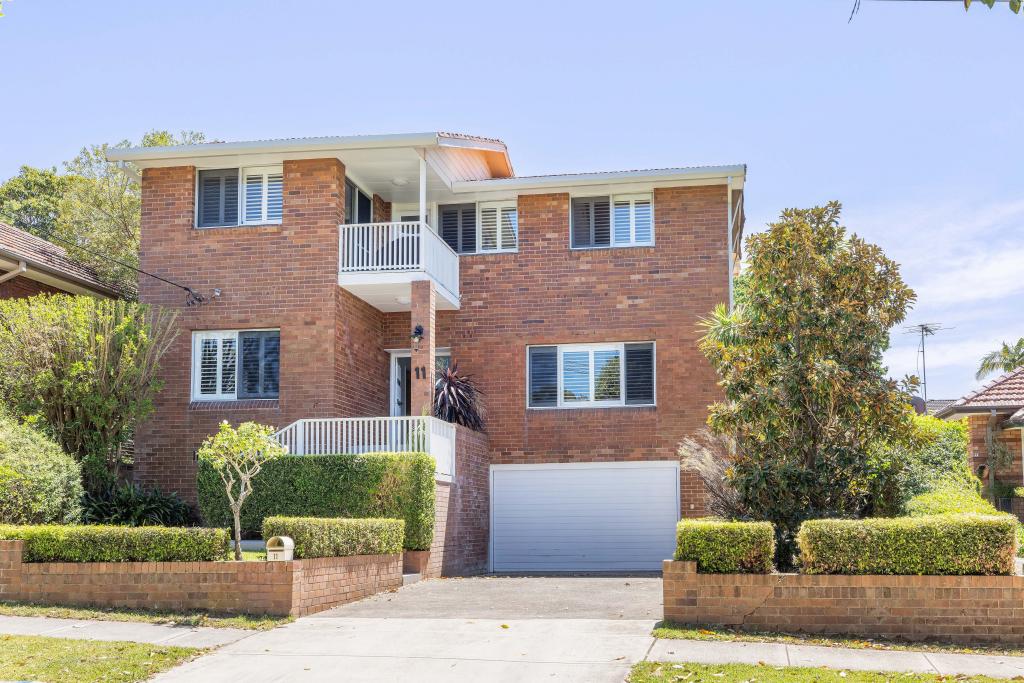 0
0 0
0 0
0Similar properties For Rent nearby
See more properties for rent nearby 0
0 0
0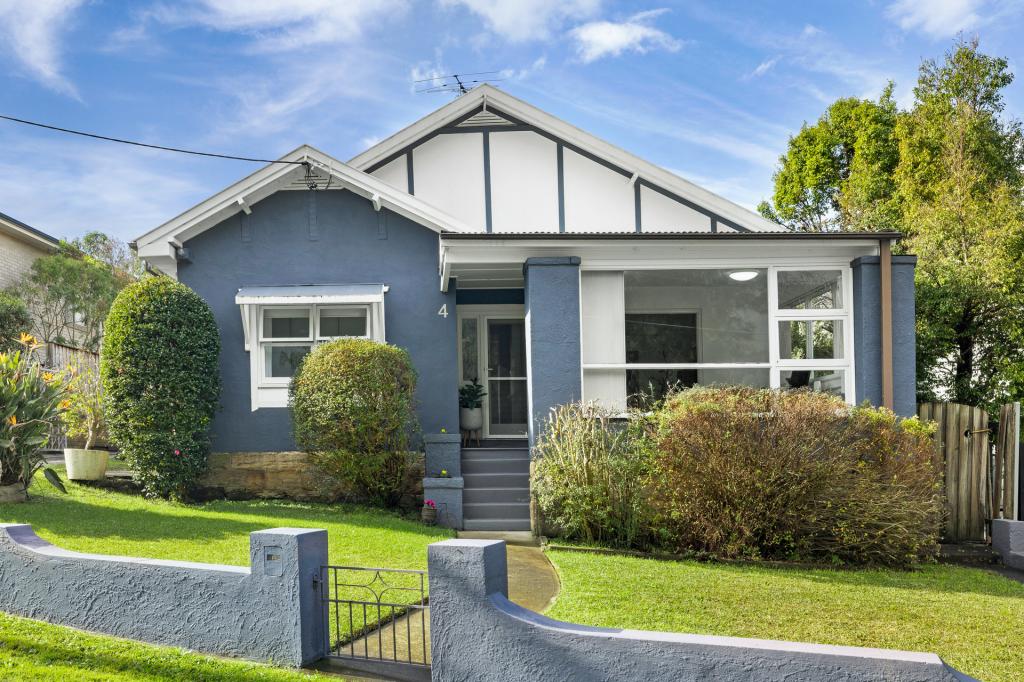 0
0About Henley 2111
The size of Henley is approximately 0.3 square kilometres. It has 2 parks covering nearly 33.5% of total area. The population of Henley in 2011 was 465 people. By 2016 the population was 479 showing a population growth of 3.0% in the area during that time. The predominant age group in Henley is 10-19 years. Households in Henley are primarily couples with children and are likely to be repaying over $4000 per month on mortgage repayments. In general, people in Henley work in a professional occupation. In 2011, 82.9% of the homes in Henley were owner-occupied compared with 79.1% in 2016.
Henley has 198 properties. Over the last 5 years, Houses in Henley have seen a 57.93% increase in median value, while Units have seen a 23.92% increase. As at 31 October 2024:
- The median value for Houses in Henley is $4,621,379 while the median value for Units is $1,595,336.
Suburb Insights for Henley 2111
Market Insights
Henley Trends for Houses
N/A
N/A
View TrendN/A
N/A
Henley Trends for Units
N/A
N/A
View TrendN/A
N/A
Neighbourhood Insights
© Copyright 2024 RP Data Pty Ltd trading as CoreLogic Asia Pacific (CoreLogic). All rights reserved.
This product uses cookies and other similar technologies to improve and customise your browsing experience, to tailor content and adverts, and for analytics and metrics regarding visitor usage on this product and other media. We may share cookie and analytics information with third parties for the purposes of advertising. By continuing to use our website, you consent to cookies being used. View our Privacy Policy here.
X