39 May RoadDee Why NSW 2099
Property Details for 39 May Rd, Dee Why
39 May Rd, Dee Why is a 5 bedroom, 5 bathroom House with 2 parking spaces and was built in 1950. The property has a land size of 556m2 and floor size of 227m2. While the property is not currently for sale or for rent, it was last sold in August 2020.
Last Listing description (August 2020)
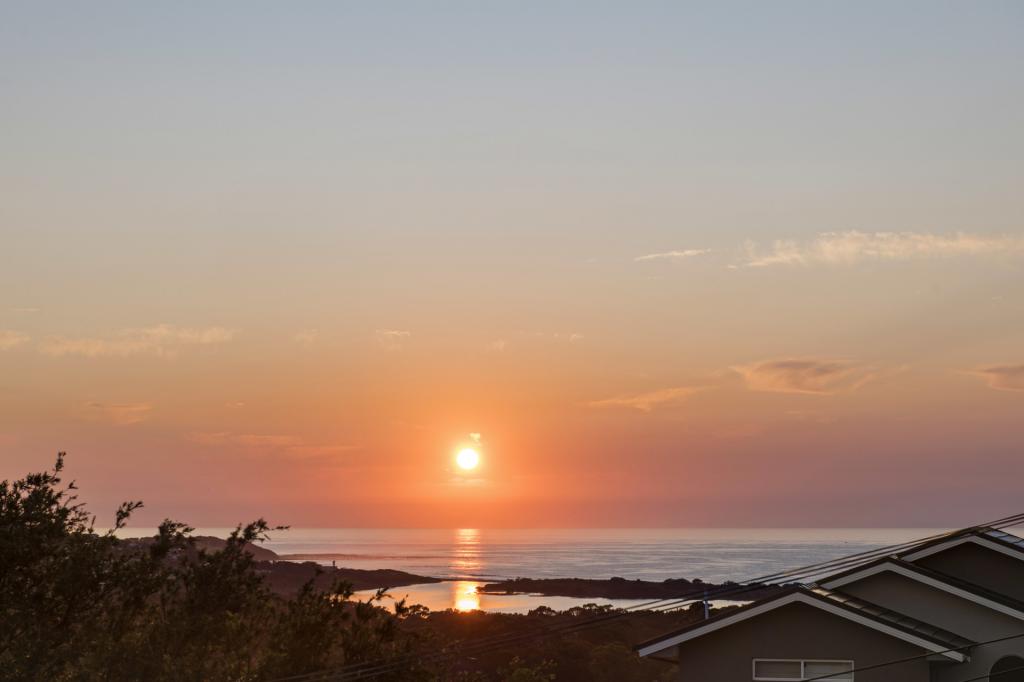
Poised to capture north east views of Long Reef Headland and the ocean, this striking contemporary home is gifted with grand living spaces adorned with deluxe custom finishes across a wonderfully scaled floorplan. Custom built with a selection of unrivalled resort-style outdoor entertaining spaces, level garden and separate granny flat. A home of supreme comfort, only a short walk from Dee Why's cosmopolitan town centre, express B-line city buses and minutes to the beach.
- Flowing open plan living area offers seamless indoor outdoor integration
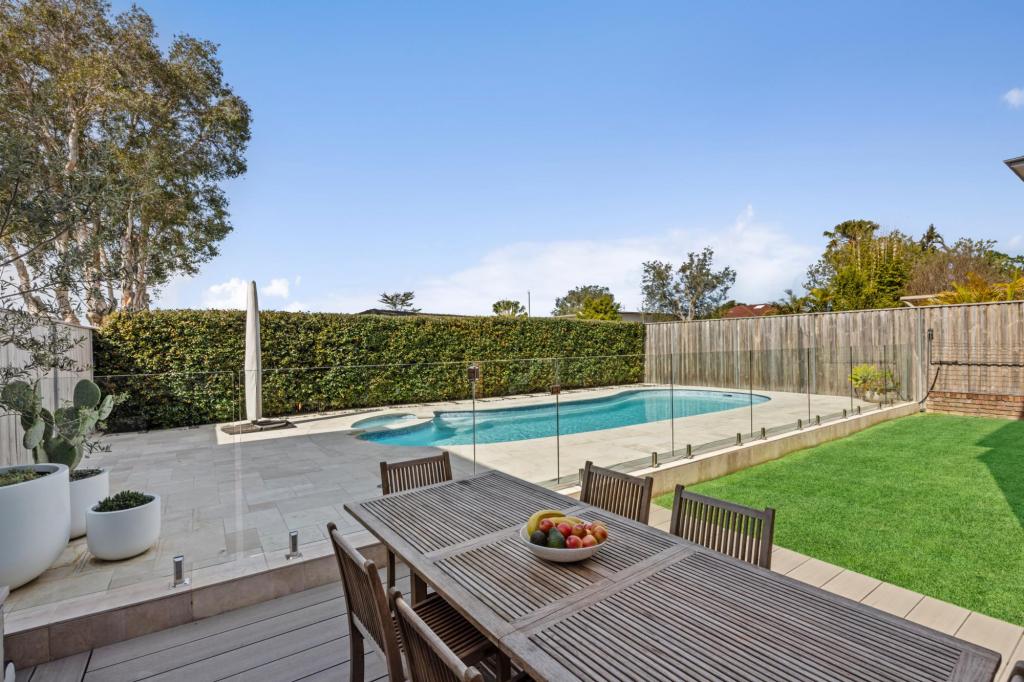
- All-season entertaining deck leads down to in-ground pool and level lawn
- Large bedrooms with built-ins, master suite with walk-in and ensuite
- Ocean-view upstairs living area, deluxe bathrooms with underfloor heating
- Granny flat perfect for in-laws/au pair accommodation with own access
- Oak flooring, ducted air conditioning, gas hot water, BBQ bayonet, outdoor w/c
- Elevated position with views to the city skyline capturing New Years Eve fireworks
- Auto double garage with internal access, under house storage or wine cellar
- Within close proximity to popular schools, ovals and Westfield Warringah Mall
Water Rates - $179.06 Per Quarter
Council Rates - $350.51 Per Quarter
Property History for 39 May Rd, Dee Why, NSW 2099
- 27 Aug 2020Sold for $2,535,000
- 30 Jul 2020Listed for Sale SOLD - Contact Agent
- 23 Jan 2017Sold
Commute Calculator
Recent sales nearby
See more recent sales nearby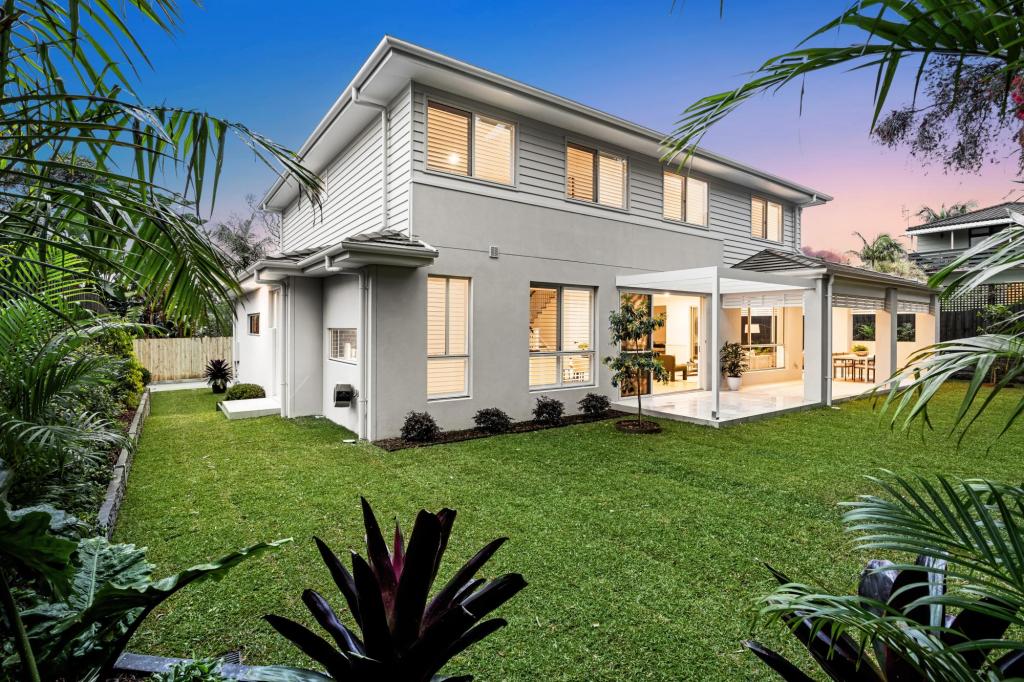 0
0
 0
0Similar properties For Sale nearby
See more properties for sale nearby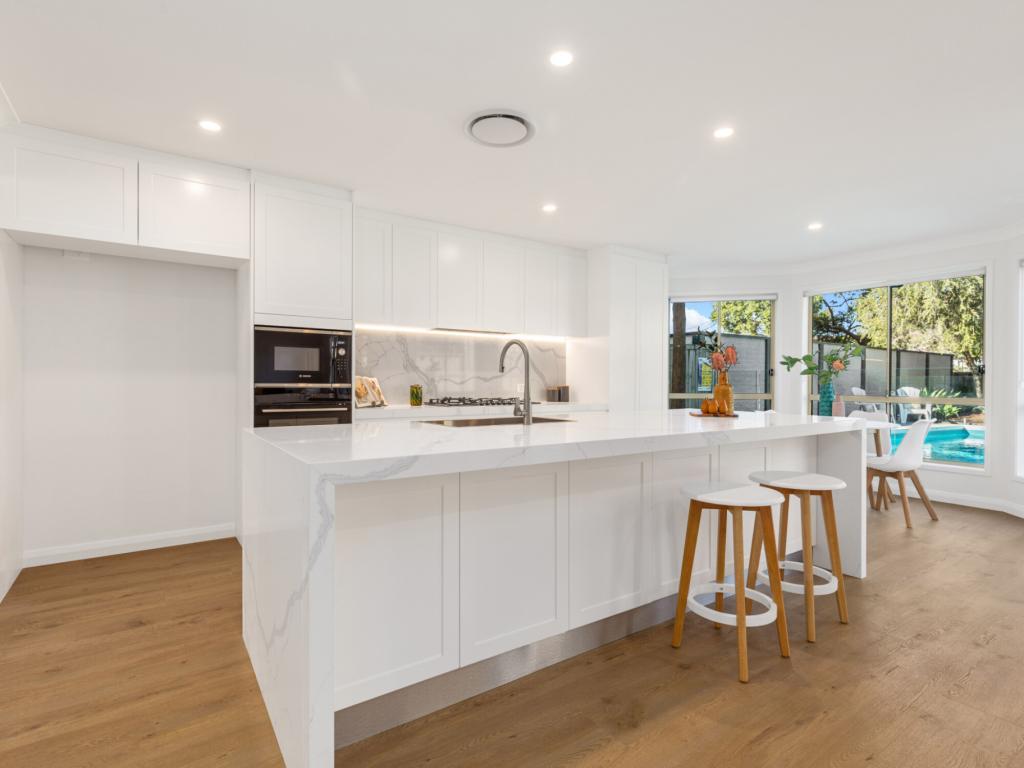 0
0
 0
0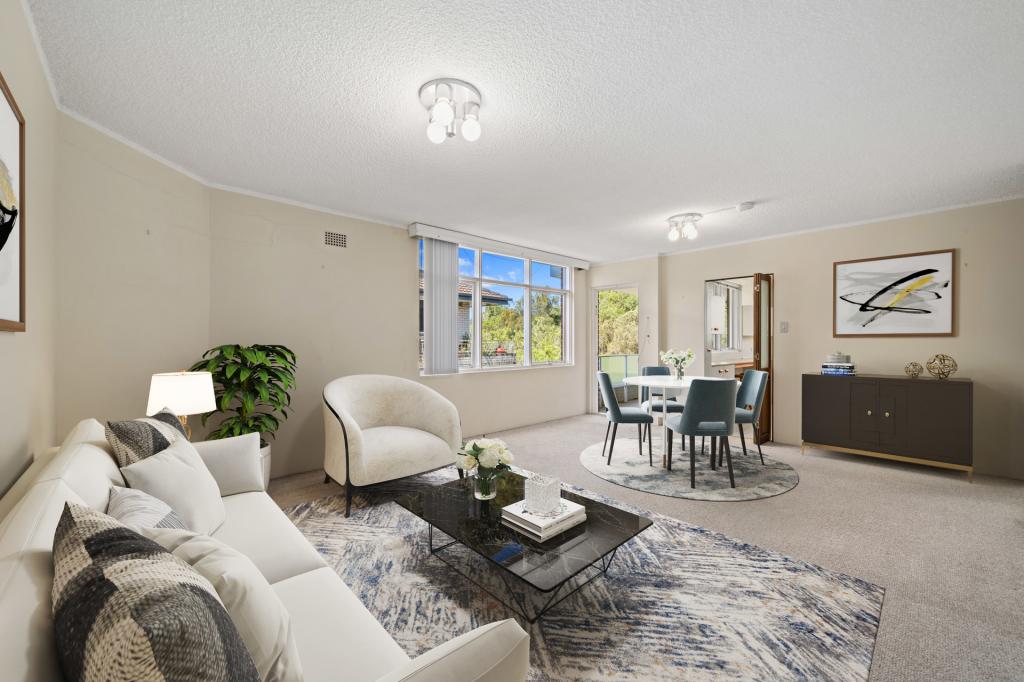 0
0
Similar properties For Rent nearby
See more properties for rent nearby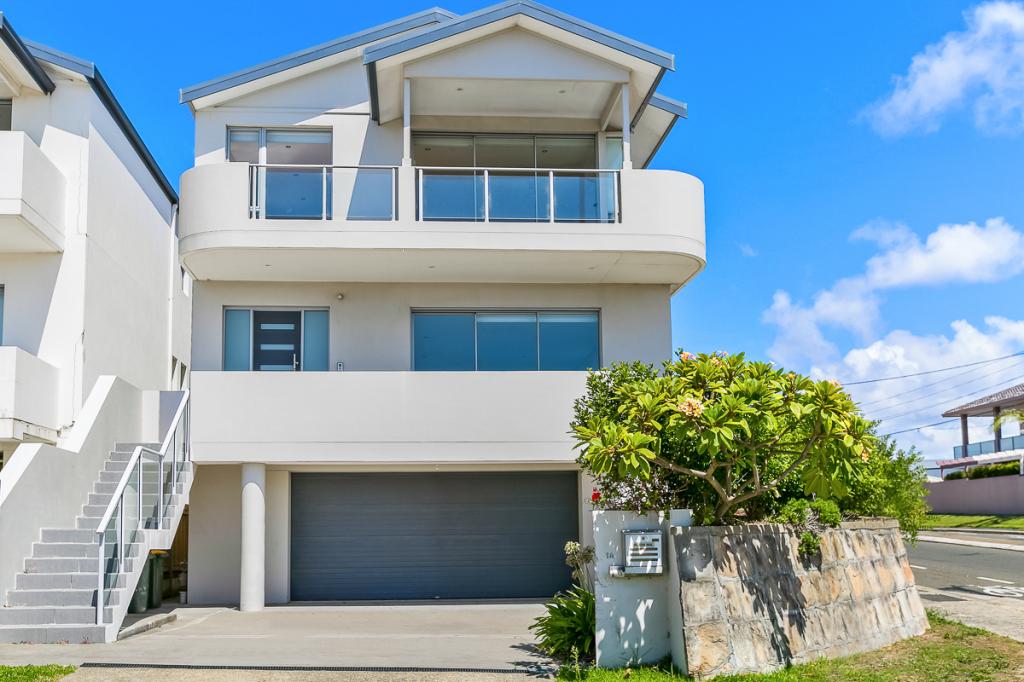 0
0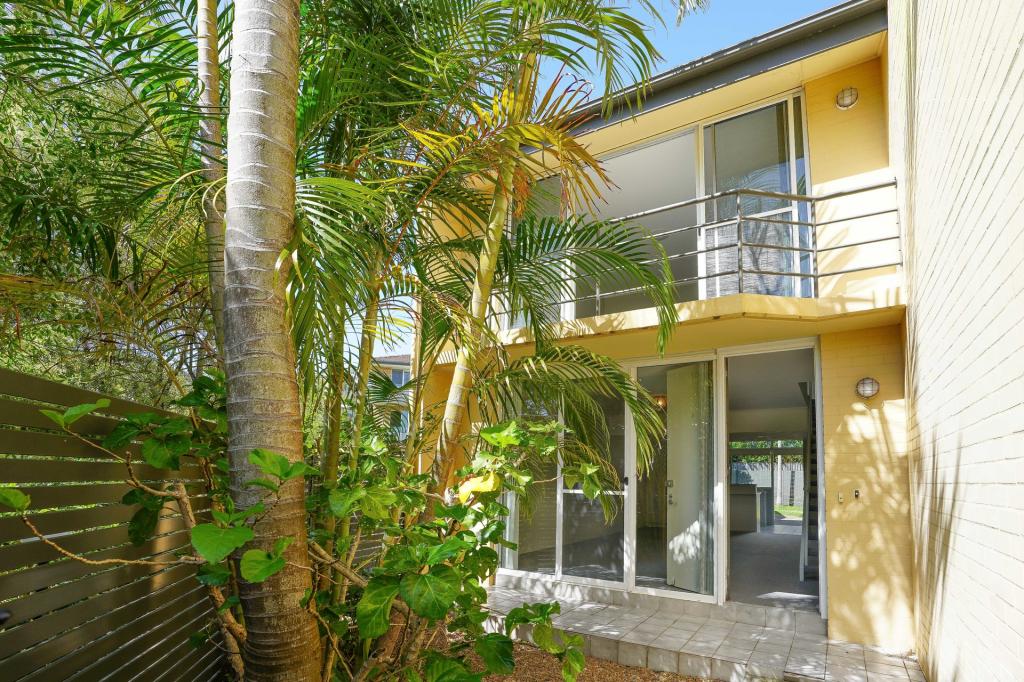 0
0 0
0About Dee Why 2099
The size of Dee Why is approximately 3.4 square kilometres. It has 11 parks covering nearly 15% of total area. The population of Dee Why in 2011 was 19,838 people. By 2016 the population was 21,524 showing a population growth of 8.5% in the area during that time. The predominant age group in Dee Why is 30-39 years. Households in Dee Why are primarily childless couples and are likely to be repaying $1800 - $2399 per month on mortgage repayments. In general, people in Dee Why work in a professional occupation. In 2011, 54.3% of the homes in Dee Why were owner-occupied compared with 50.3% in 2016.
Dee Why has 12,858 properties. Over the last 5 years, Houses in Dee Why have seen a 60.60% increase in median value, while Units have seen a 30.65% increase. As at 31 October 2024:
- The median value for Houses in Dee Why is $2,711,485 while the median value for Units is $1,015,862.
- Houses have a median rent of $790 while Units have a median rent of $700.
Suburb Insights for Dee Why 2099
Market Insights
Dee Why Trends for Houses
N/A
N/A
View TrendN/A
N/A
Dee Why Trends for Units
N/A
N/A
View TrendN/A
N/A
Neighbourhood Insights
© Copyright 2024 RP Data Pty Ltd trading as CoreLogic Asia Pacific (CoreLogic). All rights reserved.
This product uses cookies and other similar technologies to improve and customise your browsing experience, to tailor content and adverts, and for analytics and metrics regarding visitor usage on this product and other media. We may share cookie and analytics information with third parties for the purposes of advertising. By continuing to use our website, you consent to cookies being used. View our Privacy Policy here.
X