25 Undercliffe StreetDee Why NSW 2099
Property Details for 25 Undercliffe St, Dee Why
25 Undercliffe St, Dee Why is a 4 bedroom, 3 bathroom House with 1 parking spaces and was built in 1940. The property has a land size of 402m2 and floor size of 160m2. While the property is not currently for sale or for rent, it was last sold in September 2022.
Last Listing description (October 2022)
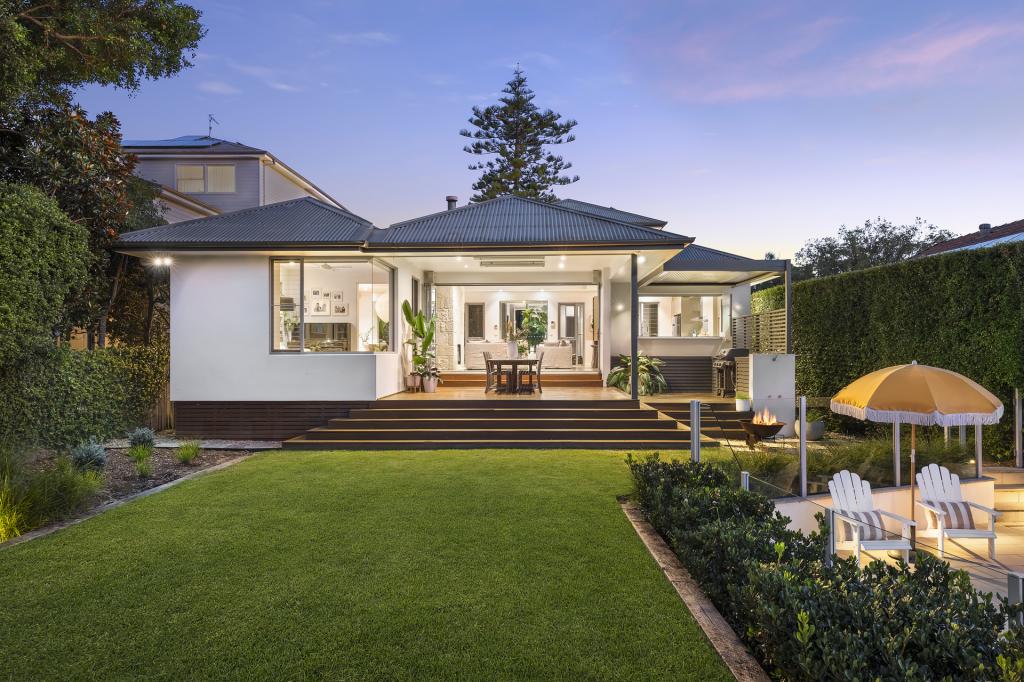
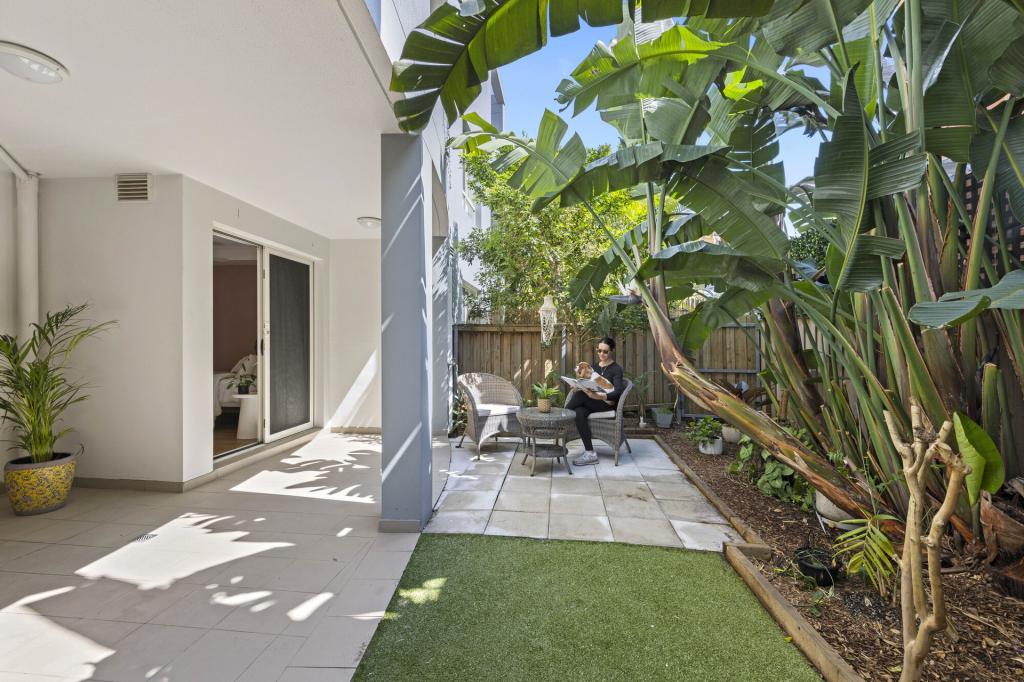
Located in a blue ribbon location of Dee Why Headland this dual level family home with income enjoys North facing sweeping views of Dee Why's lagoon and beach, Long Reef Headland and beyond. Offering an enviable opportunity to not only build your dream home but to also improve on the existing dwelling itself is a rare occurrence in this beachside locale, the properties current layout provides for a spacious modern 3 bedroom home on the lower floors and a very large 1 bedroom flat on the upper level with great flow to the near level rear lawn, perfect for someone looking to capitalize on multiple incomes.
Top floor enjoys North facing terrace with amazing Dee Why views
Large, secluded bedrooms, immense double bedroom on upper floor
High ceilings, freshly painted interiors, new floorboards upstairs
Freshly modernised exterior, also recently painted and landscaped
650m to Rockpool, coastal walks, beach, CBD express buses nearby
Lower Home Rental - $850 per week
Flat to Rear of House Rental - $580 per week
For further information on this property or to arrange a private tour, then please call Aaron Raco and his team on 0404 227 902 or 02 9971 1988.
Property History for 25 Undercliffe St, Dee Why, NSW 2099
- 13 Sep 2022Sold for $2,470,000
- 05 Jul 2022Listed for Sale Contact Agent
- 19 Aug 2021Sold
Commute Calculator
Recent sales nearby
See more recent sales nearby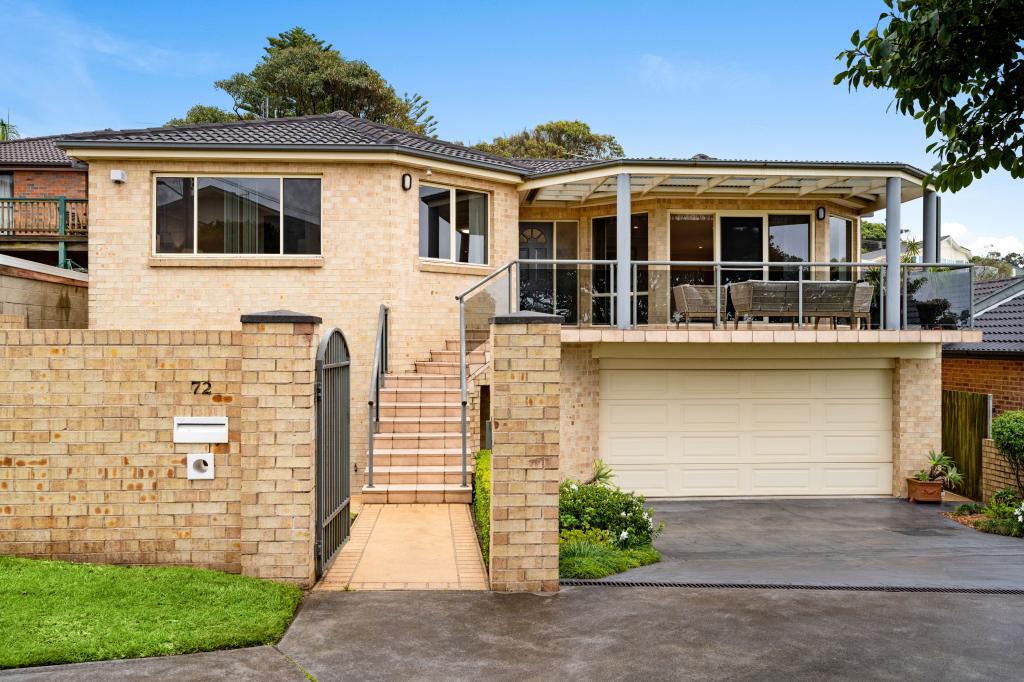 0
0
 0
0Similar properties For Sale nearby
See more properties for sale nearby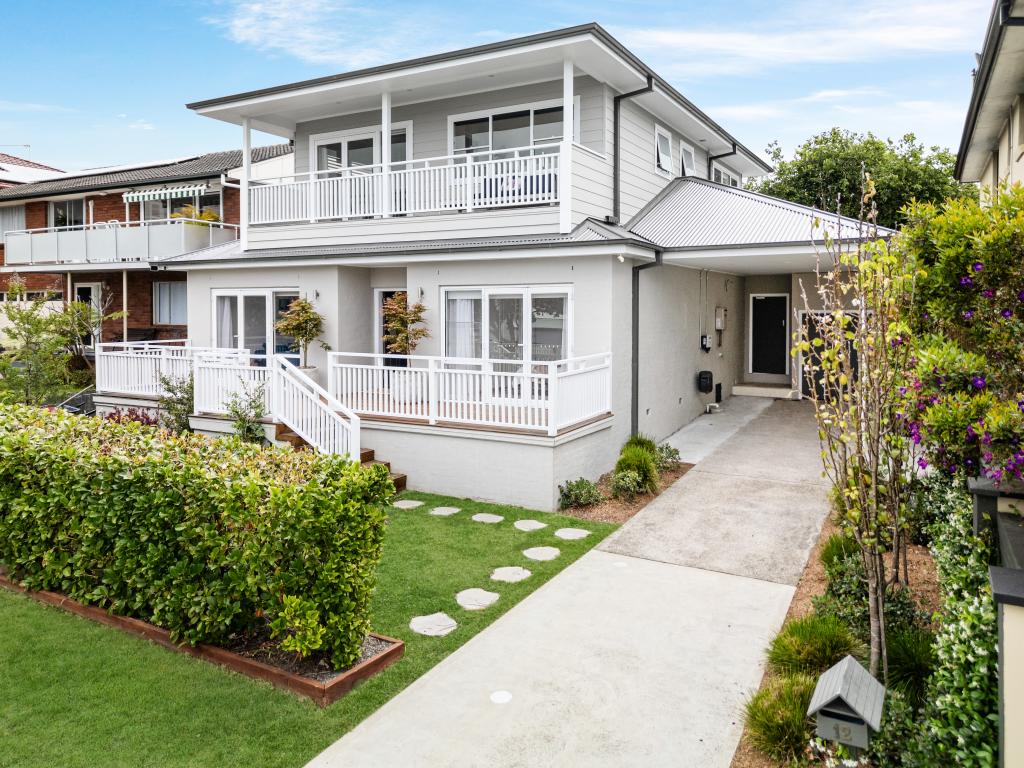 0
0
 0
0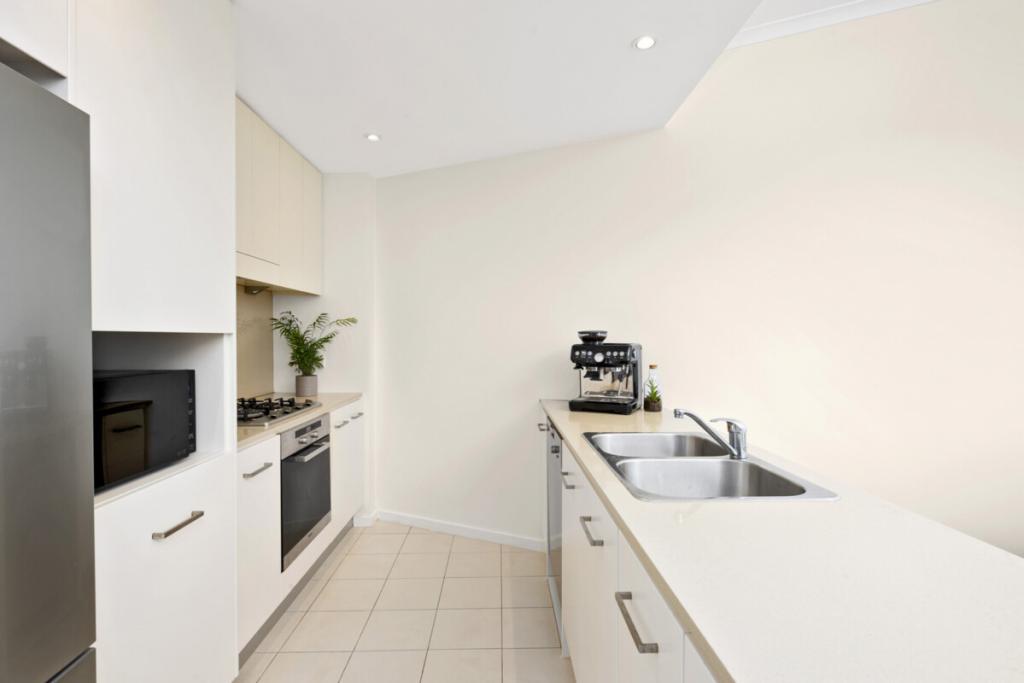 0
0
Similar properties For Rent nearby
See more properties for rent nearby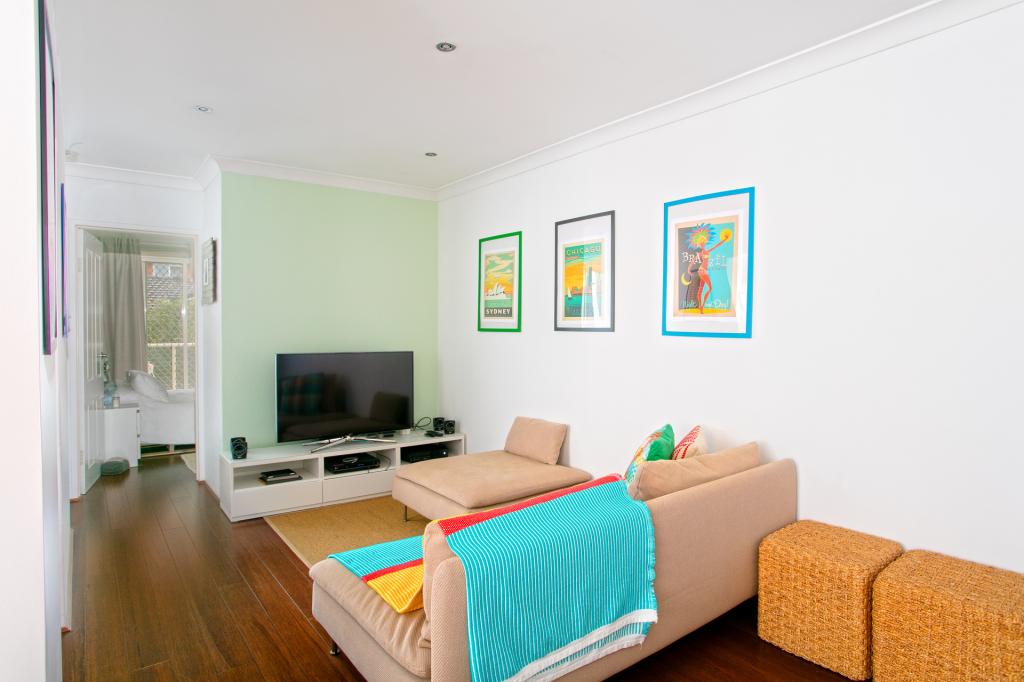 0
0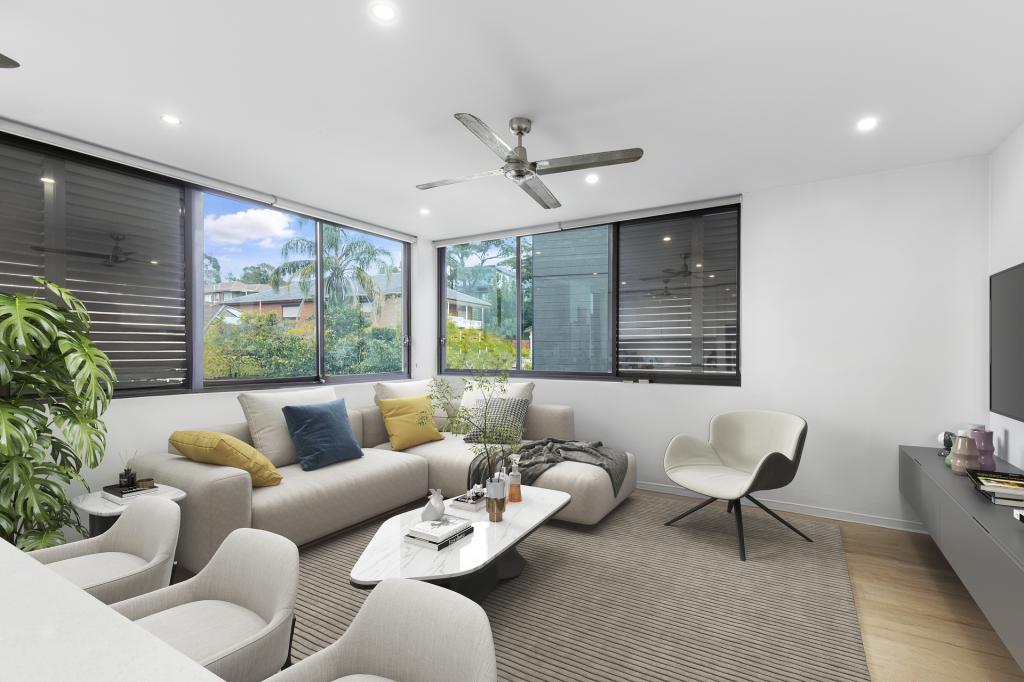 0
0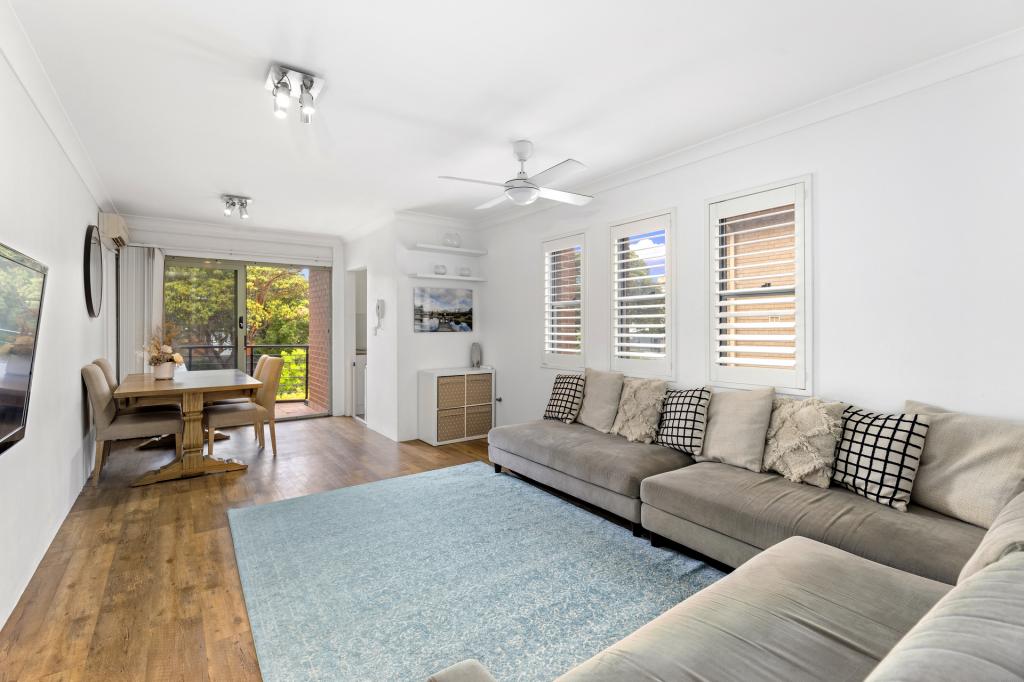 0
0About Dee Why 2099
The size of Dee Why is approximately 3.4 square kilometres. It has 11 parks covering nearly 15% of total area. The population of Dee Why in 2011 was 19,838 people. By 2016 the population was 21,524 showing a population growth of 8.5% in the area during that time. The predominant age group in Dee Why is 30-39 years. Households in Dee Why are primarily childless couples and are likely to be repaying $1800 - $2399 per month on mortgage repayments. In general, people in Dee Why work in a professional occupation. In 2011, 54.3% of the homes in Dee Why were owner-occupied compared with 50.3% in 2016.
Dee Why has 12,858 properties. Over the last 5 years, Houses in Dee Why have seen a 60.60% increase in median value, while Units have seen a 30.65% increase. As at 31 October 2024:
- The median value for Houses in Dee Why is $2,711,485 while the median value for Units is $1,015,862.
- Houses have a median rent of $790 while Units have a median rent of $700.
Suburb Insights for Dee Why 2099
Market Insights
Dee Why Trends for Houses
N/A
N/A
View TrendN/A
N/A
Dee Why Trends for Units
N/A
N/A
View TrendN/A
N/A
Neighbourhood Insights
© Copyright 2024 RP Data Pty Ltd trading as CoreLogic Asia Pacific (CoreLogic). All rights reserved.
This product uses cookies and other similar technologies to improve and customise your browsing experience, to tailor content and adverts, and for analytics and metrics regarding visitor usage on this product and other media. We may share cookie and analytics information with third parties for the purposes of advertising. By continuing to use our website, you consent to cookies being used. View our Privacy Policy here.
X