7 Olley StreetClaymore NSW 2559
Property Details for 7 Olley St, Claymore
7 Olley St, Claymore is a 4 bedroom, 2 bathroom House with 2 parking spaces and was built in 2018. The property has a land size of 470m2 and floor size of 159m2. While the property is not currently for sale or for rent, it was last sold in January 2021.
Last Listing description (March 2021)
This four bedroom home is perfect for a first home buyer or investor. Featuring a spacious kitchen overlooking open plan living and dining. This is a property you do not want to miss. Short drive to Campbell town Train Station, Just a second away from Bus stops, Walk to Blairmount public school.
- 470 SQM land
- Ducted Air conditioning throughout in living with down lights
- Double lock up garage with internal access
- 3 car parking space
- 3metre wide side access
- 2.7metre ceiling height
- Covered Pergola which is 80sqm
- 15m Frontage
Disclaimer: All information contained herein is gathered from sources we consider to be reliable, however LJ Hooker Ingleburn cannot guarantee or give any warranty to the information provided. Prospect purchasers are to rely on their own enquiries
Property History for 7 Olley St, Claymore, NSW 2559
- 10 Feb 2021Listed for Sale SOLD
- 15 Jan 2021Sold for $730,000
- 07 Mar 2017Sold for $365,000
Commute Calculator
Recent sales nearby
See more recent sales nearbySimilar properties For Sale nearby
See more properties for sale nearby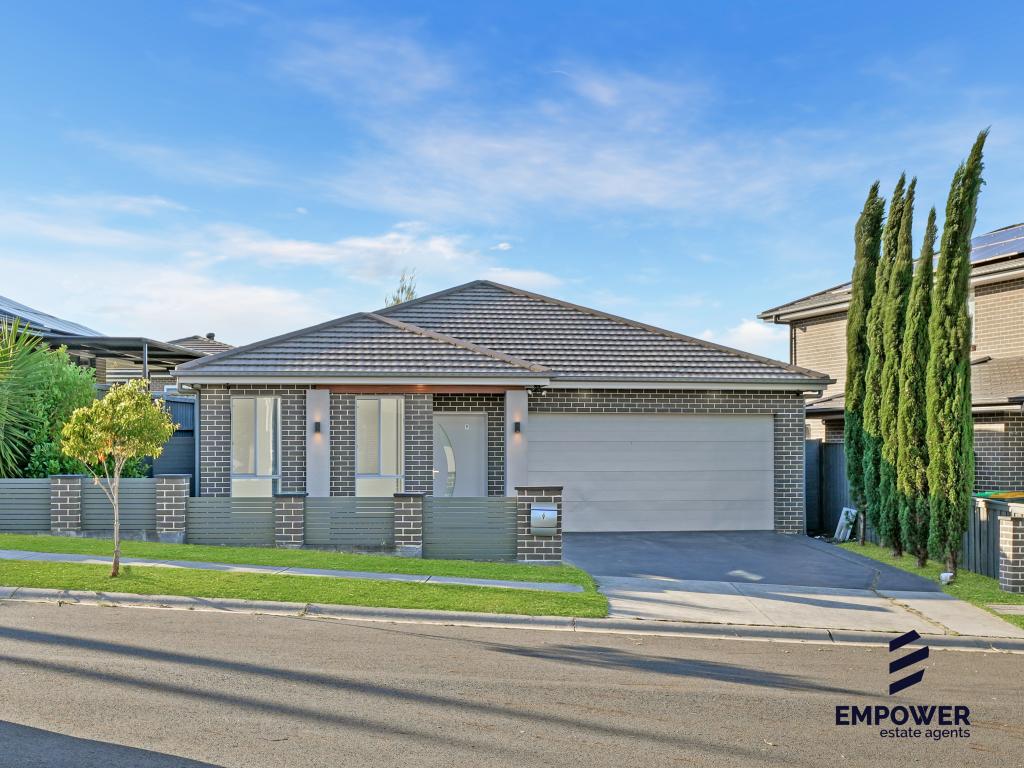 0
0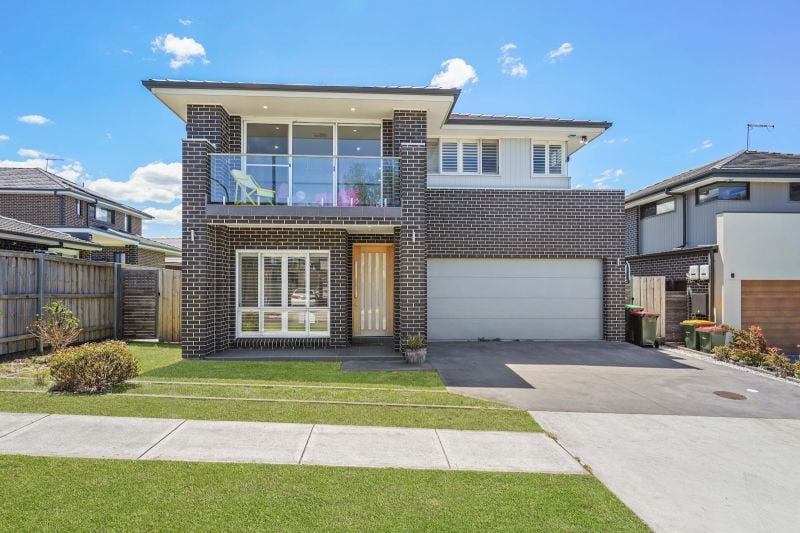 0
0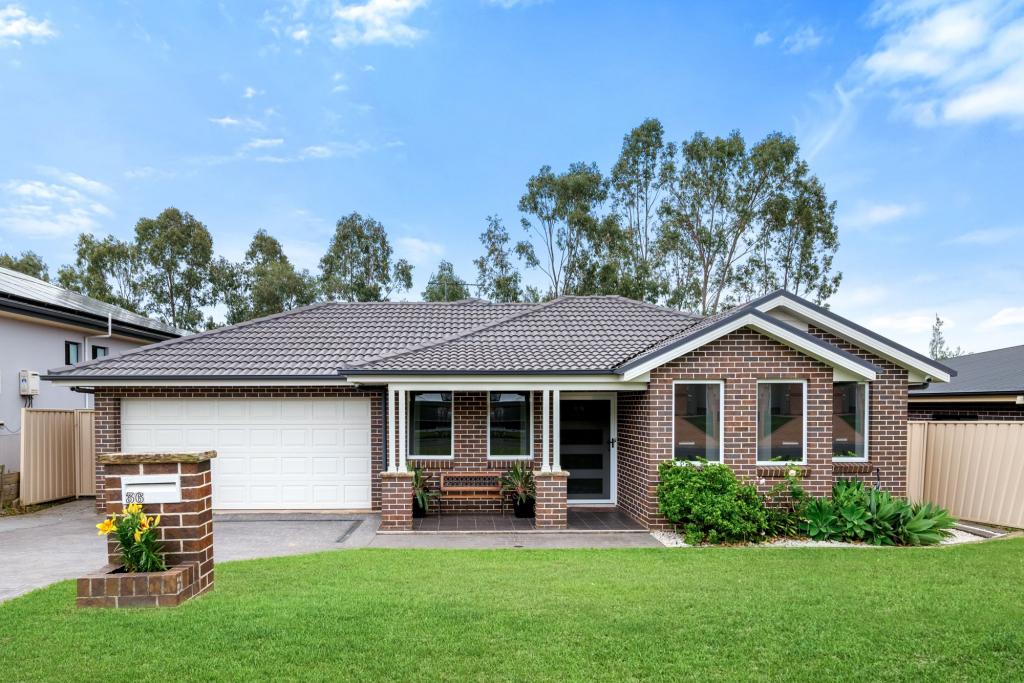 0
0Similar properties For Rent nearby
See more properties for rent nearby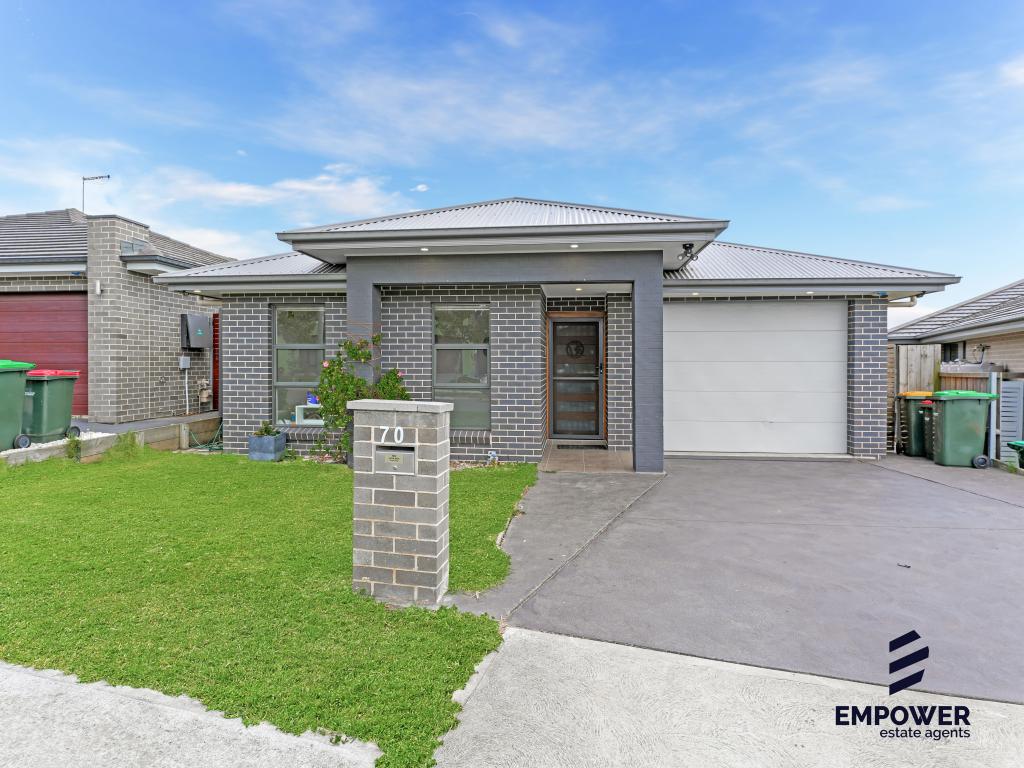 0
0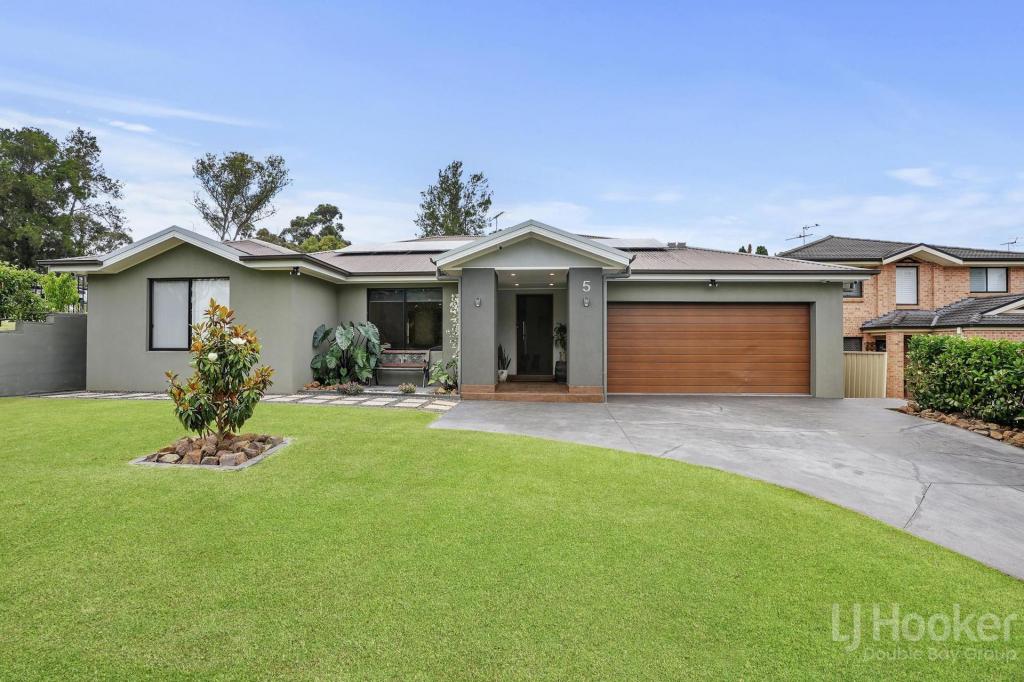 0
0 0
0
About Claymore 2559
The size of Claymore is approximately 1.4 square kilometres. It has 13 parks covering nearly 40.4% of total area. The population of Claymore in 2011 was 3,308 people. By 2016 the population was 2,636 showing a population decline of 20.3% in the area during that time. The predominant age group in Claymore is 10-19 years. Households in Claymore are primarily single parents and are likely to be repaying $450 - $599 per month on mortgage repayments. In general, people in Claymore work in a labourer occupation. In 2006, 2.6% of the homes in Claymore were owner-occupied compared with 1% in 2011.
Claymore has 1,285 properties. Over the last 5 years, Houses in Claymore have seen a 51.95% increase in median value, while Units have seen a 49.31% increase. As at 31 October 2024:
- The median value for Houses in Claymore is $1,002,322 while the median value for Units is $801,678.
- Houses have a median rent of $730.
Suburb Insights for Claymore 2559
Market Insights
Claymore Trends for Houses
N/A
N/A
View TrendN/A
N/A
Claymore Trends for Units
N/A
N/A
View TrendN/A
N/A
Neighbourhood Insights
© Copyright 2024 RP Data Pty Ltd trading as CoreLogic Asia Pacific (CoreLogic). All rights reserved.
This product uses cookies and other similar technologies to improve and customise your browsing experience, to tailor content and adverts, and for analytics and metrics regarding visitor usage on this product and other media. We may share cookie and analytics information with third parties for the purposes of advertising. By continuing to use our website, you consent to cookies being used. View our Privacy Policy here.
X