11 Clare StreetCabramatta West NSW 2166
Property Details for 11 Clare St, Cabramatta West
11 Clare St, Cabramatta West is a 2 bedroom, 1 bathroom House and was built in 1965. The property has a land size of 570m2 and floor size of 107m2. While the property is not currently for sale or for rent, it was last sold in November 2002.
Last Listing description (March 2021)
This spacious half-house is situated in a quiet neighbourhood in Cabramatta West. Ready to move in - it is an ideal place for starters: 2 spacious bedrooms, Huge living room with extra space for your comfort living, Update kitchen, Modern bathroom
Easy to maintain with tiles throughout, Walk to school and bus stops. Remark: There is NO off street parking, and yards are excluded from lease. Available Now
Property History for 11 Clare St, Cabramatta West, NSW 2166
- 08 Jan 2021Listed for Rent $250 / week
- 18 Mar 2016Listed for Rent - Price not available
- 26 Aug 2015Listed for Rent - Price not available
Commute Calculator
Recent sales nearby
See more recent sales nearby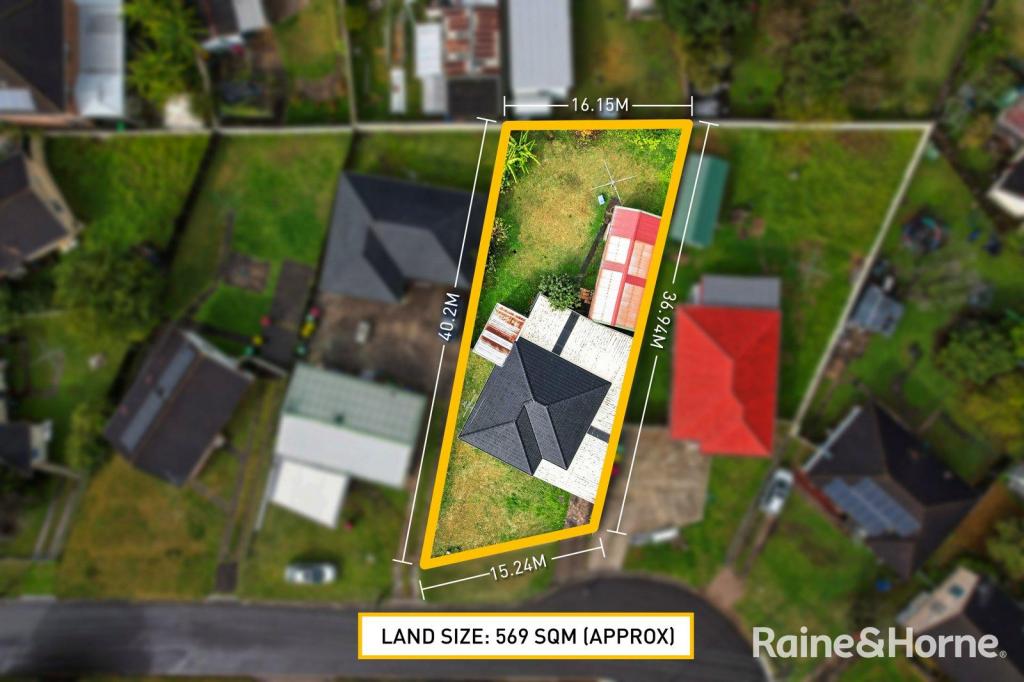 0
0
 0
0
Similar properties For Sale nearby
See more properties for sale nearby 0
0 0
0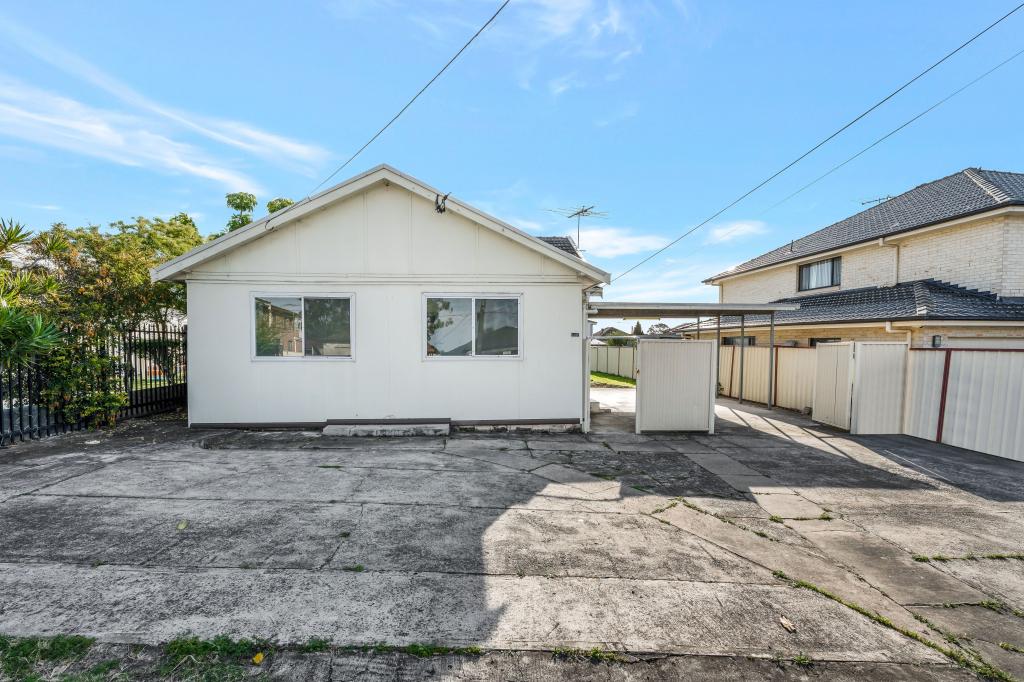 0
0Similar properties For Rent nearby
See more properties for rent nearby 0
0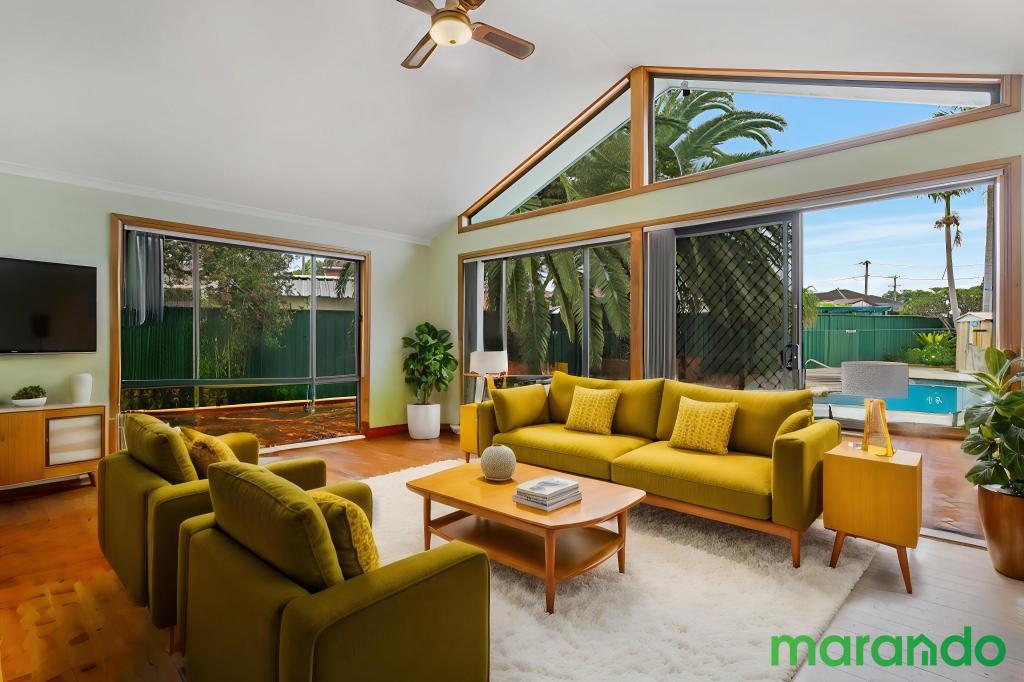 0
0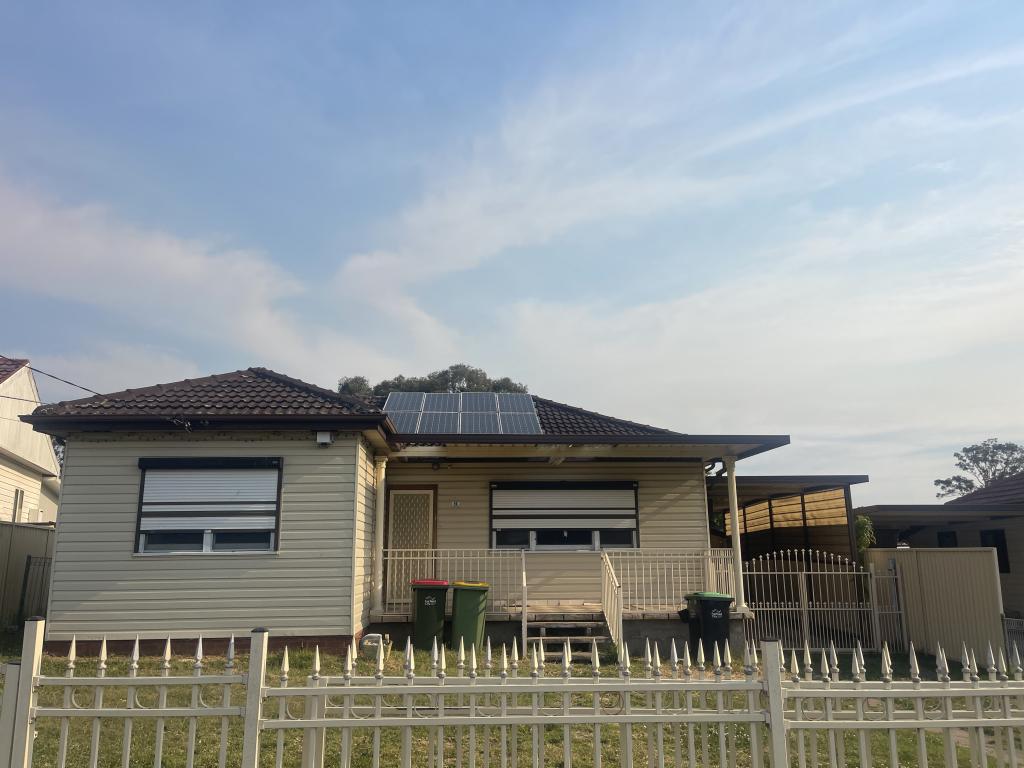 0
0About Cabramatta West 2166
The size of Cabramatta West is approximately 1.8 square kilometres. It has 4 parks covering nearly 5.1% of total area. The population of Cabramatta West in 2011 was 6,767 people. By 2016 the population was 7,211 showing a population growth of 6.6% in the area during that time. The predominant age group in Cabramatta West is 10-19 years. Households in Cabramatta West are primarily couples with children and are likely to be repaying $1800 - $2399 per month on mortgage repayments. In general, people in Cabramatta West work in a labourer occupation. In 2011, 63.9% of the homes in Cabramatta West were owner-occupied compared with 59.4% in 2016.
Cabramatta West has 2,299 properties. Over the last 5 years, Houses in Cabramatta West have seen a 87.87% increase in median value, while Units have seen a 51.80% increase. As at 30 September 2024:
- The median value for Houses in Cabramatta West is $1,146,435 while the median value for Units is $767,166.
- Houses have a median rent of $650 while Units have a median rent of $470.
Suburb Insights for Cabramatta West 2166
Market Insights
Cabramatta West Trends for Houses
N/A
N/A
View TrendN/A
N/A
Cabramatta West Trends for Units
N/A
N/A
View TrendN/A
N/A
Neighbourhood Insights
© Copyright 2024 RP Data Pty Ltd trading as CoreLogic Asia Pacific (CoreLogic). All rights reserved.
This product uses cookies and other similar technologies to improve and customise your browsing experience, to tailor content and adverts, and for analytics and metrics regarding visitor usage on this product and other media. We may share cookie and analytics information with third parties for the purposes of advertising. By continuing to use our website, you consent to cookies being used. View our Privacy Policy here.
X