133 South Liverpool RoadBusby NSW 2168
Property Details for 133 South Liverpool Rd, Busby
133 South Liverpool Rd, Busby is a 3 bedroom, 1 bathroom House. The property has a land size of 670m2 and floor size of 87m2. While the property is not currently for sale or for rent, it was last sold in May 2019.
Last Listing description (February 2024)
This lovely 3 bedroom family home is located in a sort after quiet area, with the convenience & comforts you are looking for!
Features include:
Lawn maintenance included
Neat & tidy renovated bathroom.
Separate 2nd toilet in laundry
Large modern, fresh Kitchen with ample storage
Air conditioning
Spacious, open plan living and dining area
Timber look flooring throughout bedrooms & tiles in living areas
Large fully fenced, Over sized Alfresco area, garden shed & drive through gate access
Close to Schools, Shops, Parks & Public Transport
Property History for 133 South Liverpool Rd, Busby, NSW 2168
- 01 Feb 2024Listed for Rent $500 / week
- 12 Mar 2020Listed for Rent - Price not available
- 25 May 2019Sold for $512,000
Commute Calculator
Recent sales nearby
See more recent sales nearby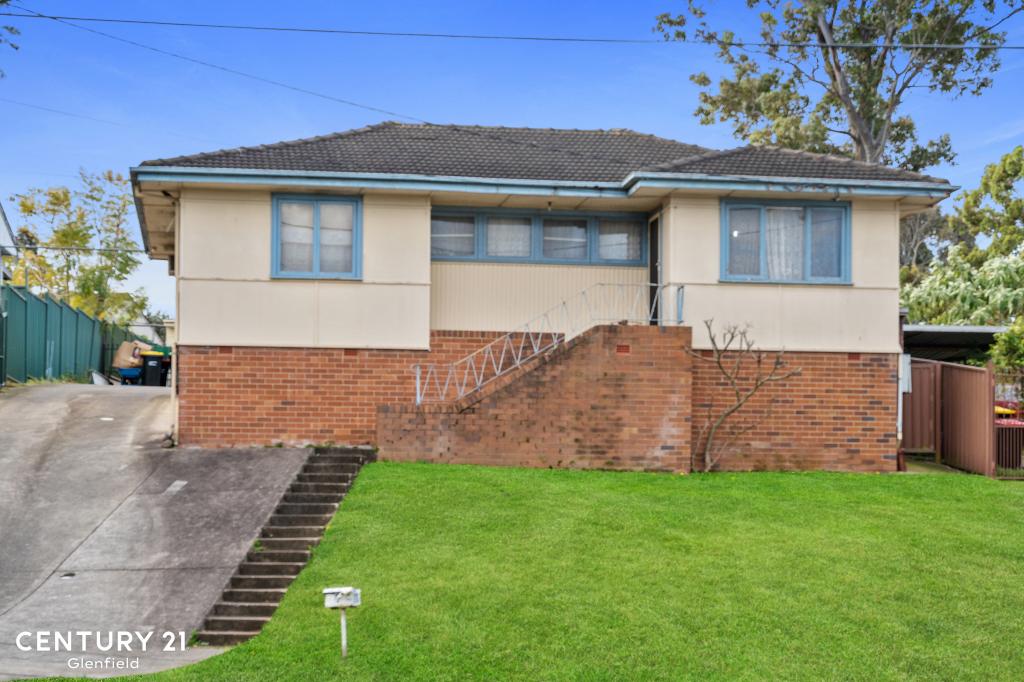 0
0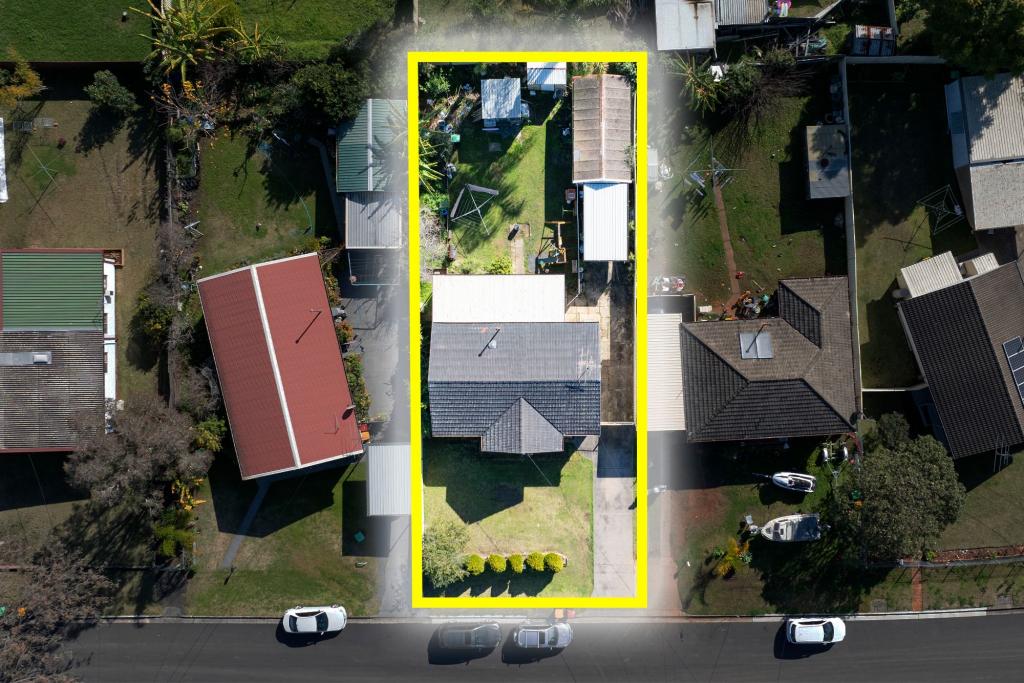 0
0Similar properties For Sale nearby
See more properties for sale nearby 0
0 0
0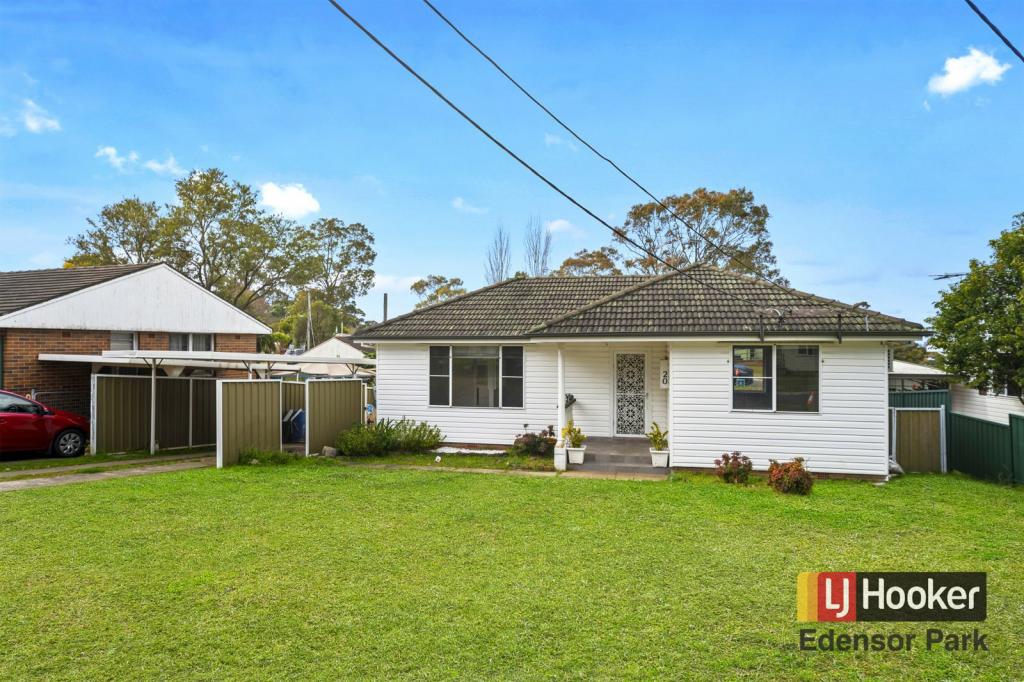 0
0Similar properties For Rent nearby
See more properties for rent nearby 0
0
 0
0 0
0About Busby 2168
The size of Busby is approximately 1.2 square kilometres. It has 9 parks covering nearly 12% of total area. The population of Busby in 2011 was 4,208 people. By 2016 the population was 4,302 showing a population growth of 2.2% in the area during that time. The predominant age group in Busby is 0-9 years. Households in Busby are primarily couples with children and are likely to be repaying $1800 - $2399 per month on mortgage repayments. In general, people in Busby work in a machinery operators and drivers occupation. In 2011, 51.5% of the homes in Busby were owner-occupied compared with 47.7% in 2016.
Busby has 1,458 properties. Over the last 5 years, Houses in Busby have seen a 68.27% increase in median value, while Units have seen a 19.99% increase. As at 31 August 2024:
- The median value for Houses in Busby is $850,485 while the median value for Units is $528,678.
- Houses have a median rent of $530 while Units have a median rent of $320.
Suburb Insights for Busby 2168
Market Insights
Busby Trends for Houses
N/A
N/A
View TrendN/A
N/A
Busby Trends for Units
N/A
N/A
View TrendN/A
N/A
Neighbourhood Insights
© Copyright 2024 RP Data Pty Ltd trading as CoreLogic Asia Pacific (CoreLogic). All rights reserved.
This product uses cookies and other similar technologies to improve and customise your browsing experience, to tailor content and adverts, and for analytics and metrics regarding visitor usage on this product and other media. We may share cookie and analytics information with third parties for the purposes of advertising. By continuing to use our website, you consent to cookies being used. View our Privacy Policy here.
X