49 Steeltrap DriveBungarribee NSW 2767
Property Details for 49 Steeltrap Dr, Bungarribee
49 Steeltrap Dr, Bungarribee is a 4 bedroom, 3 bathroom House with 2 parking spaces and was built in 2017. The property has a land size of 316m2 and floor size of 219m2. While the property is not currently for sale or for rent, it was last sold in May 2018.
Last Listing description (April 2018)
This BRAND NEW house beckons you to call it HOME!!!
Features:
-3bedrooms all with built-ins
-Open plan living/dining/kitchen
-Kitchen with stone benchtops, GAS appliances and a dishwasher
-Tiled downstairs & Timber flooring upstairs
-Rear Pergola, entertaining area
-Ducted air-con with 2 zones
-Remote lock up garage
-Close to Featherdale Wildlife Park
-Short distances to Western Sydney Parklands, local shopping centres, Doonside train station, Great Western Highway & M4 Motorways
-728 Bus Service at your door
Call now for an inspection!
Property History for 49 Steeltrap Dr, Bungarribee, NSW 2767
- 21 May 2018Sold for $820,000
- 06 Apr 2018Listed for Rent $630 / week
Commute Calculator
Recent sales nearby
See more recent sales nearby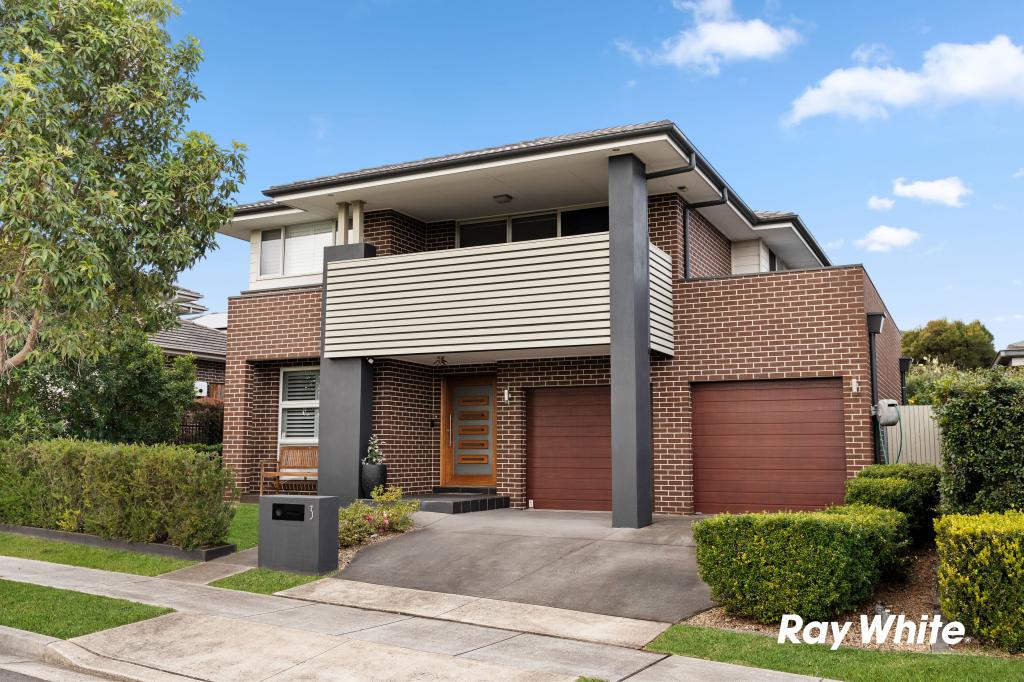 0
0Similar properties For Sale nearby
See more properties for sale nearby 0
0 0
0 0
0Similar properties For Rent nearby
See more properties for rent nearby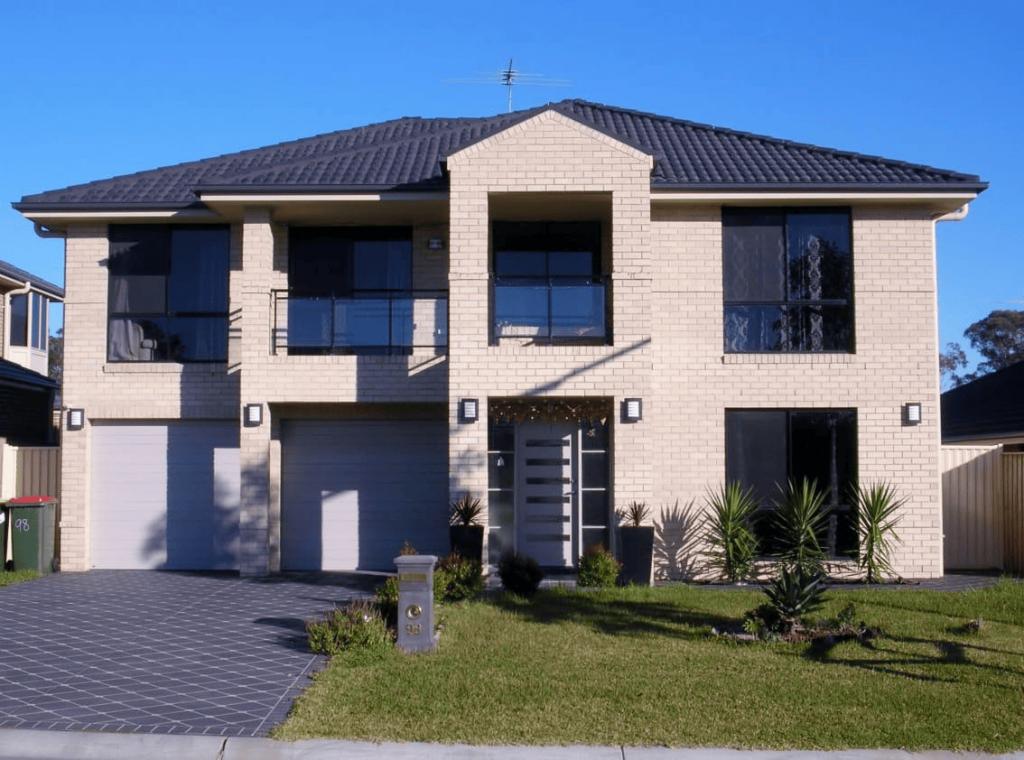 0
0 0
0 0
0About Bungarribee 2767
The size of Bungarribee is approximately 3.5 square kilometres. It has 6 parks covering nearly 76.9% of total area. The population of Bungarribee in 2011 was 13,086 people. By 2016 the population was 2,635 showing a population decline of 79.9% in the area during that time. The predominant age group in Bungarribee is 30-39 years. Households in Bungarribee are primarily couples with children and are likely to be repaying $3000 - $3999 per month on mortgage repayments. In general, people in Bungarribee work in a professional occupation. In 2011, 55.4% of the homes in Bungarribee were owner-occupied compared with 92.2% in 2016.
Bungarribee has 851 properties. Over the last 5 years, Houses in Bungarribee have seen a 41.19% increase in median value, while Units have seen a 44.07% increase. As at 31 December 2024:
- The median value for Houses in Bungarribee is $1,136,249 while the median value for Units is $789,282.
- Houses have a median rent of $850 while Units have a median rent of $436.
Suburb Insights for Bungarribee 2767
Market Insights
Bungarribee Trends for Houses
N/A
N/A
View TrendN/A
N/A
Bungarribee Trends for Units
N/A
N/A
View TrendN/A
N/A
Neighbourhood Insights
© Copyright 2025 RP Data Pty Ltd trading as CoreLogic Asia Pacific (CoreLogic). All rights reserved.
This product uses cookies and other similar technologies to improve and customise your browsing experience, to tailor content and adverts, and for analytics and metrics regarding visitor usage on this product and other media. We may share cookie and analytics information with third parties for the purposes of advertising. By continuing to use our website, you consent to cookies being used. View our Privacy Policy here.
X