32 Fingal StreetBrunswick Heads NSW 2483

Property Details for 32 Fingal St, Brunswick Heads
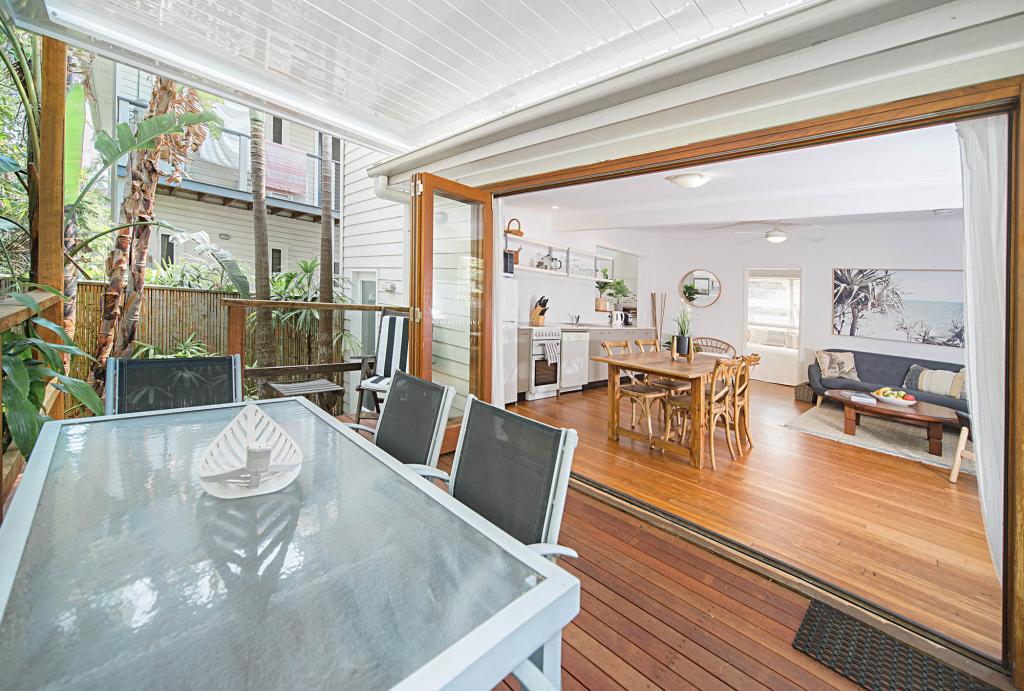
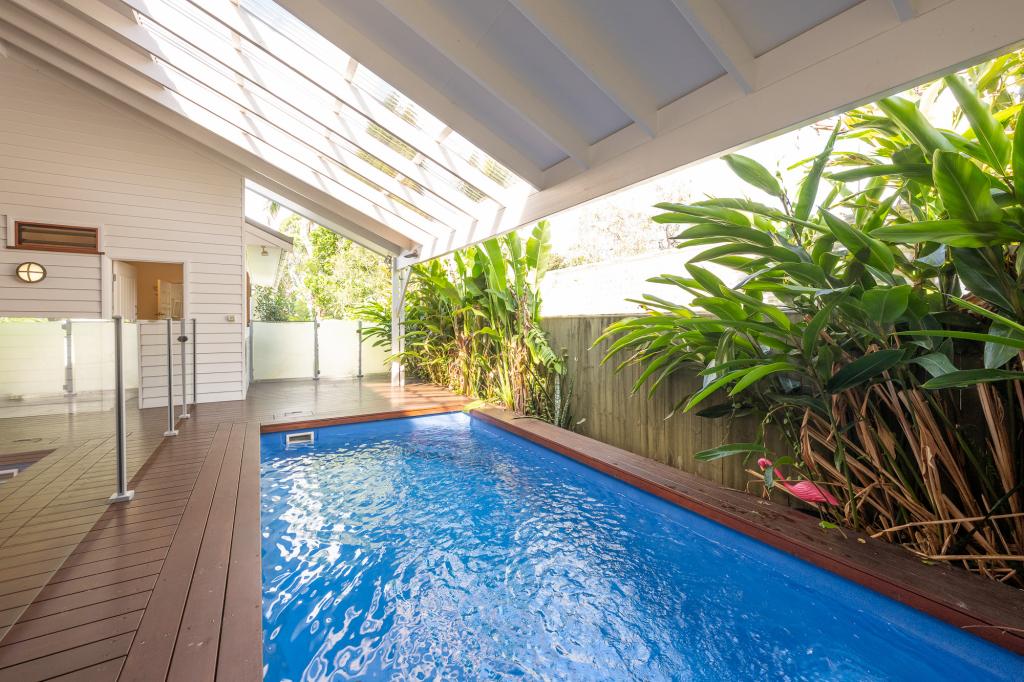
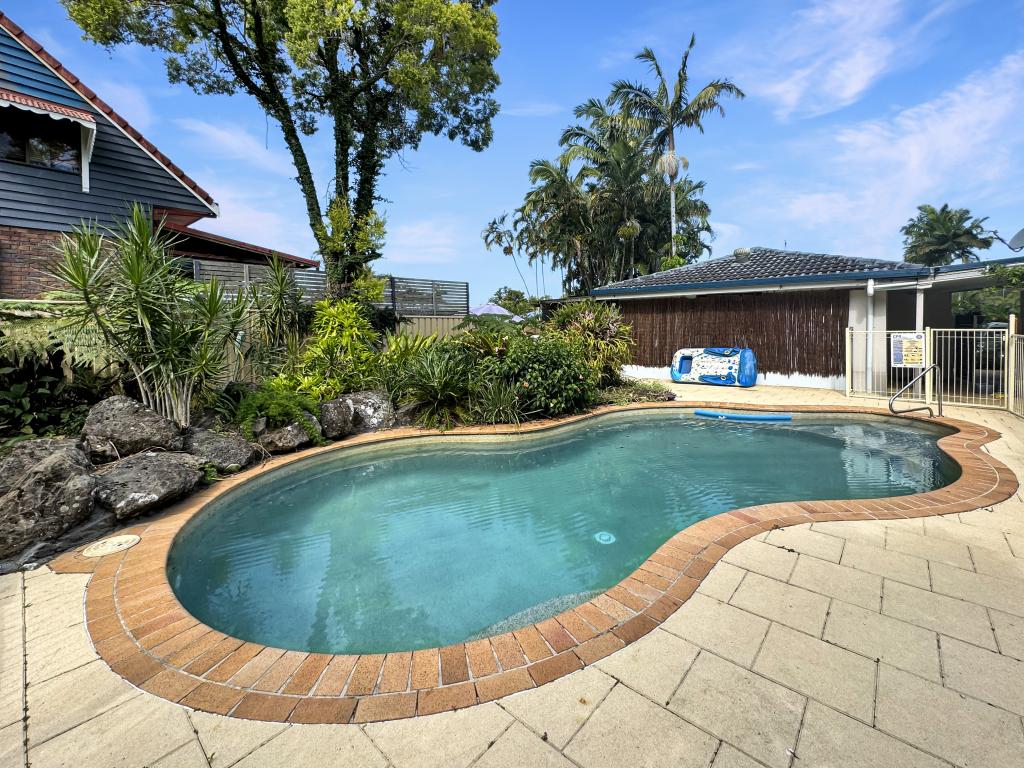
32 Fingal St, Brunswick Heads is a 10 bedroom, 4 bathroom Unit and was built in 1950. The property has a land size of 1012m2 and floor size of 413m2.
Property History for 32 Fingal St, Brunswick Heads, NSW 2483
Recent sales nearby
See more recent sales nearbySimilar properties For Sale nearby
See more properties for sale nearby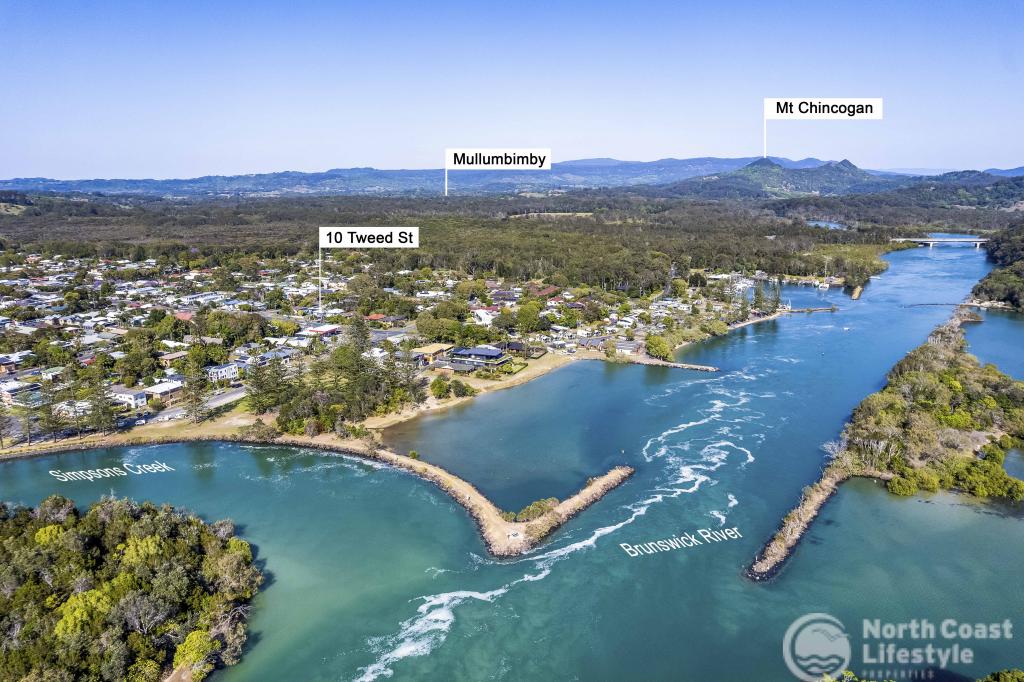
Similar properties For Rent nearby
See more properties for rent nearby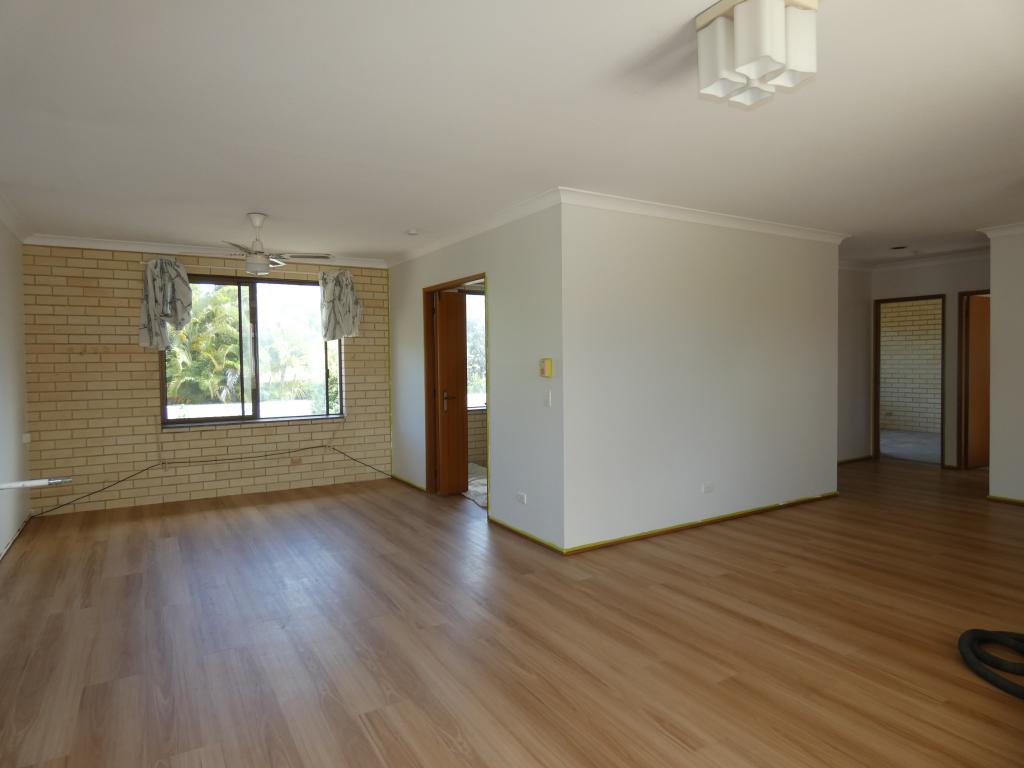
About Brunswick Heads 2483
The size of Brunswick Heads is approximately 14.4 square kilometres. It has 13 parks covering nearly 28.1% of total area. The population of Brunswick Heads in 2011 was 1,637 people. By 2016 the population was 1,739 showing a population growth of 6.2% in the area during that time. The predominant age group in Brunswick Heads is 50-59 years. Households in Brunswick Heads are primarily childless couples and are likely to be repaying $1800 - $2399 per month on mortgage repayments. In general, people in Brunswick Heads work in a professional occupation. In 2011, 48.7% of the homes in Brunswick Heads were owner-occupied compared with 53.9% in 2016.
Brunswick Heads has 1,348 properties. Over the last 5 years, Houses in Brunswick Heads have seen a 43.42% increase in median value, while Units have seen a 47.54% increase. As at 28 February 2025:
- The median value for Houses in Brunswick Heads is $1,268,093 while the median value for Units is $997,269.
- Houses have a median rent of $875 while Units have a median rent of $690.
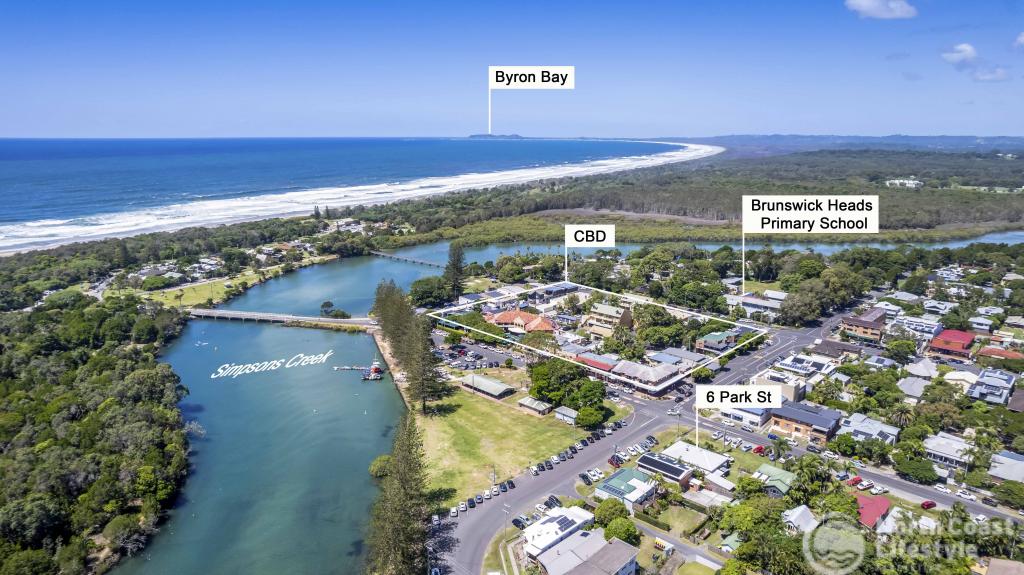
What's around 32 Fingal St, Brunswick Heads
32 Fingal St, Brunswick Heads is in the school catchment zone for Brunswick Heads Public School and Mullumbimby High School.


Suburb Insights for Brunswick Heads 2483
Market Insights
Brunswick Heads Trends for Houses
$1.27M
8.93%
View Trend$875/W
3.67%
Brunswick Heads Trends for Units
$997k
7.23%
View Trend$690/W
3.46%
Neighbourhood Insights
Age
Population 1,739
0-9
8%
10-19
11%
20-29
7%
30-39
10%
40-49
15%
50-59
17%
60-69
16%
70-79
11%
80-89
5%
90-99
1%
Household Structure
Occupancy
© Copyright 2025 RP Data Pty Ltd trading as CoreLogic Asia Pacific (CoreLogic). All rights reserved.
This product uses cookies and other similar technologies to improve and customise your browsing experience, to tailor content and adverts, and for analytics and metrics regarding visitor usage on this product and other media. We may share cookie and analytics information with third parties for the purposes of advertising. By continuing to use our website, you consent to cookies being used. View our Privacy Policy here.
X