22 Castlereagh AvenueBinnaway NSW 2395
Property Details for 22 Castlereagh Ave, Binnaway
22 Castlereagh Ave, Binnaway is a 3 bedroom, 1 bathroom House with 2 parking spaces and was built in 1900. The property has a land size of 1163m2 and floor size of 166m2. While the property is not currently for sale or for rent, it was last sold in October 2012.
Last Listing description (November 2009)
RIVER VIEWS...
IN CONJUNCTION WITH LARRY TOLMIE BINNAWAY 0427 441605 THIS BEAUTIFULLY PRESENTED TWO BEDROOM DOUBLE BRICK HOME HAS A SLEEPOUT, SUNROOM, LARGE LOUNGE ROOM WITH WOOD AND GAS HEATING, CEILING FANS, VERTICALS T/O, BUILT INS. TILED BATHROOM. CARPETED THROUGH OUT. FRESHLY PAINTED INSIDE AND OUT. 24 X 26FT LOCK UP COLOUR BOND DOUBLE GARAGE WITH CEMENT FLOOR AND POWER CONNECTED. LOCK UP SHED AND STABLE. FULLY FENCED BACK YARD. ESTABLISHED LAWNS AND GARDENS SET ON A QUARTER ACRE BLOCK......
THIS INFORMATION HAS BEEN OBTAINED FROM A THIRD PARTY. WE MAKE NO REPRESENTATION TO ITS ACCURACY. ALL PHOTO'S, COMPUTER IMAGES AND MAPS ARE INDICATIVE ONLY. WE ARE MERELY PASSING ON THE INFORMATION. INTERESTED PARTIES SHOULD MAKE THEIR OWN ENQUIRIES
Property History for 22 Castlereagh Ave, Binnaway, NSW 2395
- 03 Oct 2012Sold for $85,000
- 27 Oct 2009Sold for $128,000
- 27 Sep 2009Listed for Sale $138,000 NEGOTIABLE
Commute Calculator
Recent sales nearby
See more recent sales nearby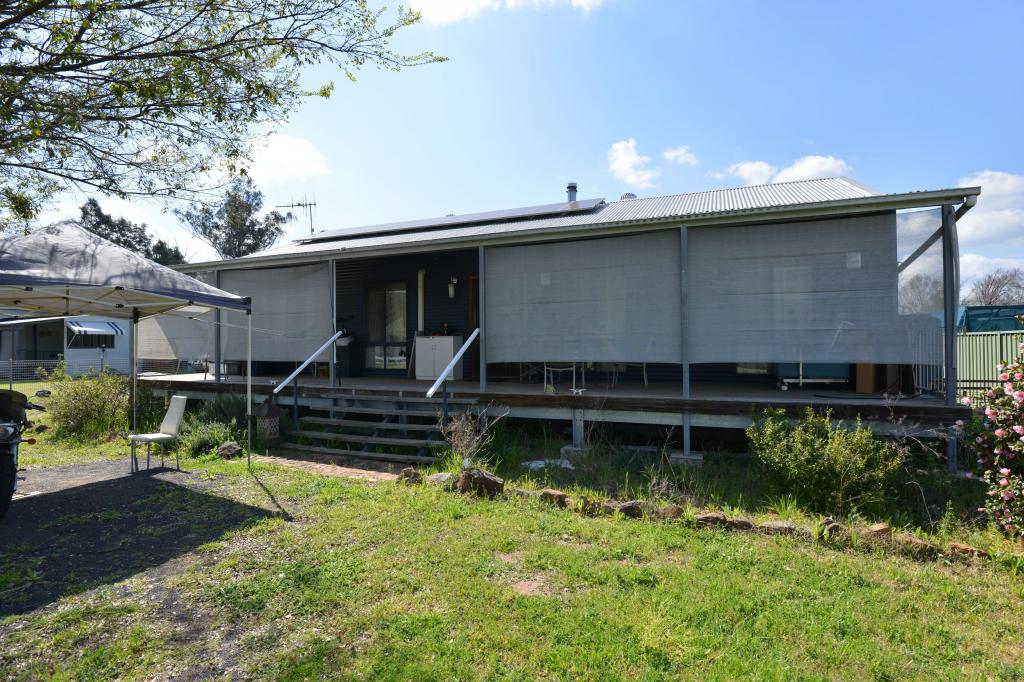 0
0 0
0
About Binnaway 2395
The size of Binnaway is approximately 948 square kilometres. It has 2 parks covering nearly 4.1% of total area. The population of Binnaway in 2011 was 780 people. By 2016 the population was 606 showing a population decline of 22.3% in the area during that time. The predominant age group in Binnaway is 60-69 years. Households in Binnaway are primarily childless couples and are likely to be repaying $300 - $449 per month on mortgage repayments. In general, people in Binnaway work in a managers occupation. In 2011, 71.1% of the homes in Binnaway were owner-occupied compared with 71.1% in 2016.
Binnaway has 614 properties. Over the last 5 years, Houses in Binnaway have seen a 105.26% increase in median value, while Units have seen a 95.84% increase. As at 30 November 2024:
- The median value for Houses in Binnaway is $165,194 while the median value for Units is $335,331.
Suburb Insights for Binnaway 2395
Market Insights
Binnaway Trends for Houses
N/A
N/A
View TrendN/A
N/A
Binnaway Trends for Units
N/A
N/A
View TrendN/A
N/A
Neighbourhood Insights
© Copyright 2024 RP Data Pty Ltd trading as CoreLogic Asia Pacific (CoreLogic). All rights reserved.
This product uses cookies and other similar technologies to improve and customise your browsing experience, to tailor content and adverts, and for analytics and metrics regarding visitor usage on this product and other media. We may share cookie and analytics information with third parties for the purposes of advertising. By continuing to use our website, you consent to cookies being used. View our Privacy Policy here.
X