49 Cecilia StreetBelmore NSW 2192
Property Details for 49 Cecilia St, Belmore
49 Cecilia St, Belmore is a 3 bedroom, 1 bathroom House with 1 parking spaces and was built in 1950. The property has a land size of 446m2 and floor size of 91m2. While the property is not currently for sale or for rent, it was last sold in April 2022.
Last Listing description (April 2022)
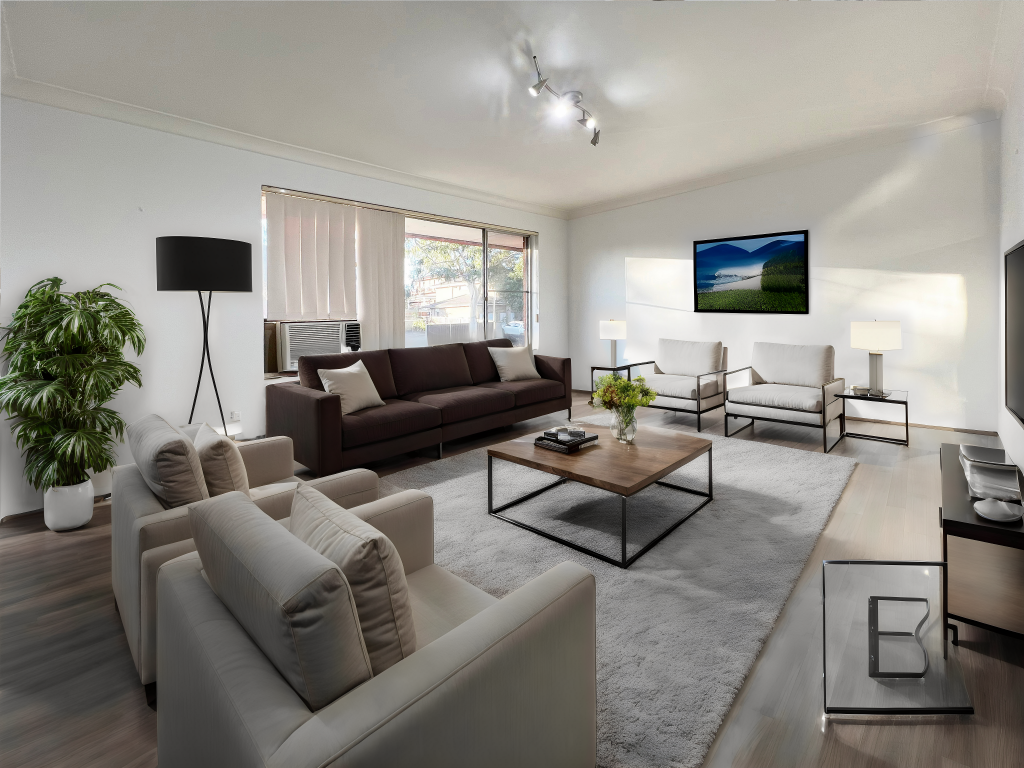
Set on 442.6 square metres of land with R3 zoning, this three bedroom family home is on the market and presents a load of potential. Perfect for all buyers, this property features three perfectly sized bedrooms, a massive living room, dual backyards (with side access via double gates) and a spacious front yard.
With a leafy outlook, the property is fully equipped with a single lockup garage and built-in workshop, the property is also located in a nice little cul-de-sac.
The property is located closely to:
The Lemnos by Clarence House
All Saints Grammar School
Canterbury Leagues Club
Belmore Train Station
Belmore Sports Ground
Belmore Boys High School and Belmore North Public School
Land Size | 442.6sqm
Land Dimensions | 35m x 43.2m x 25.3m
Contact Jordon Le Breux on 0414 585 364
Available All Day, Every Day
Property History for 49 Cecilia St, Belmore, NSW 2192
- 29 Apr 2022Sold for $1,130,000
- 31 Jan 2022Listed for Sale $1,089,950
Commute Calculator
Recent sales nearby
See more recent sales nearby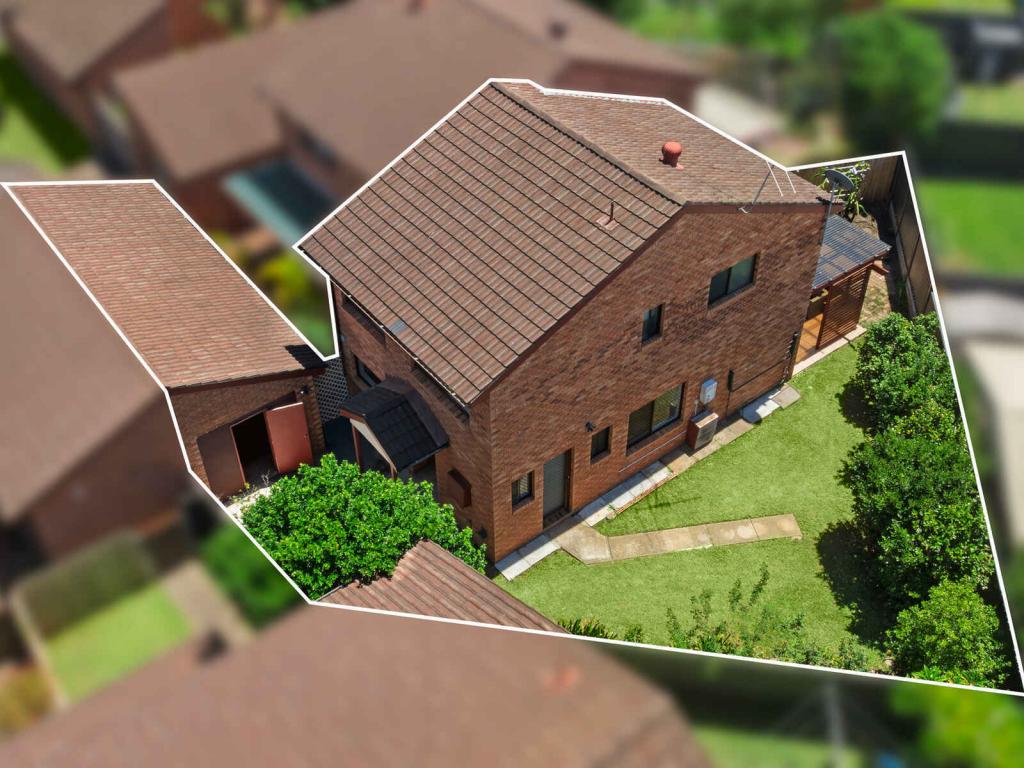 0
0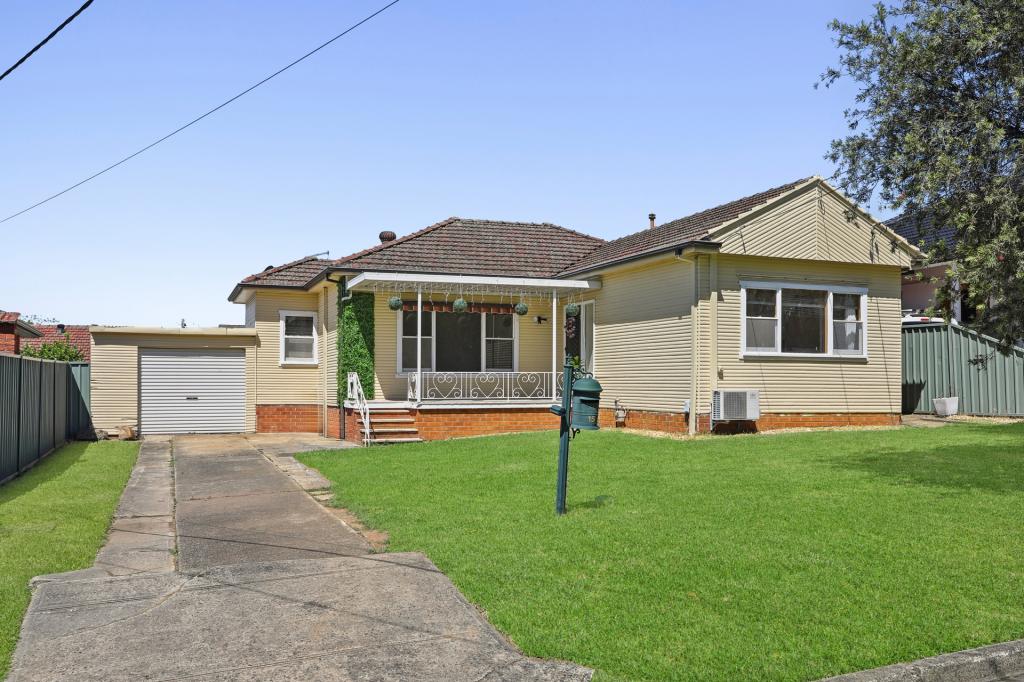 0
0Similar properties For Sale nearby
See more properties for sale nearby 0
0
 0
0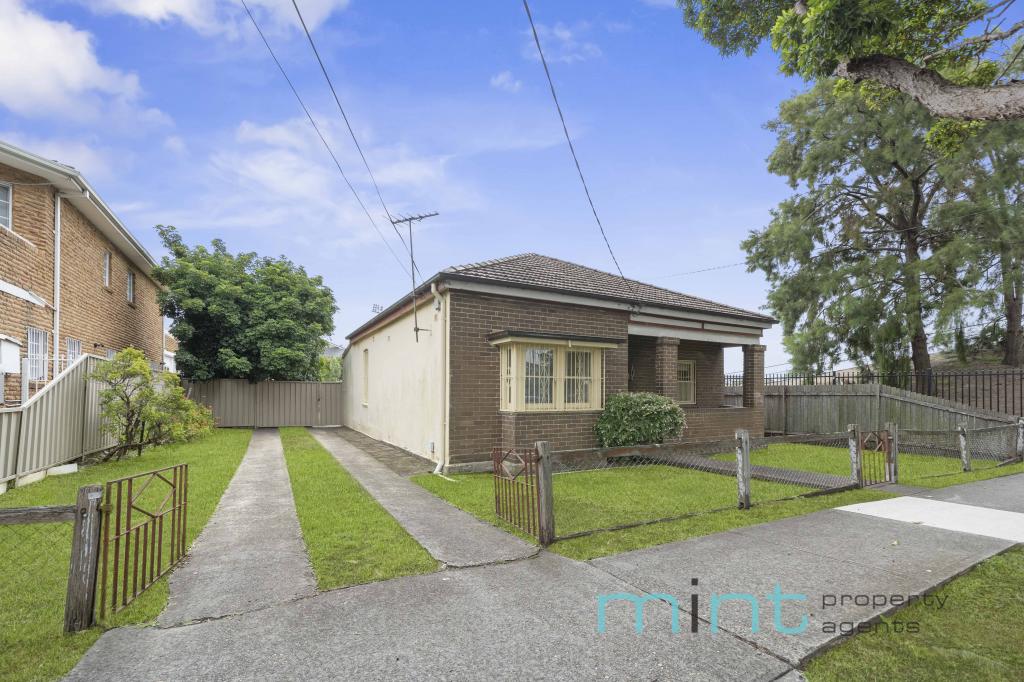 0
0Similar properties For Rent nearby
See more properties for rent nearby 0
0
 0
0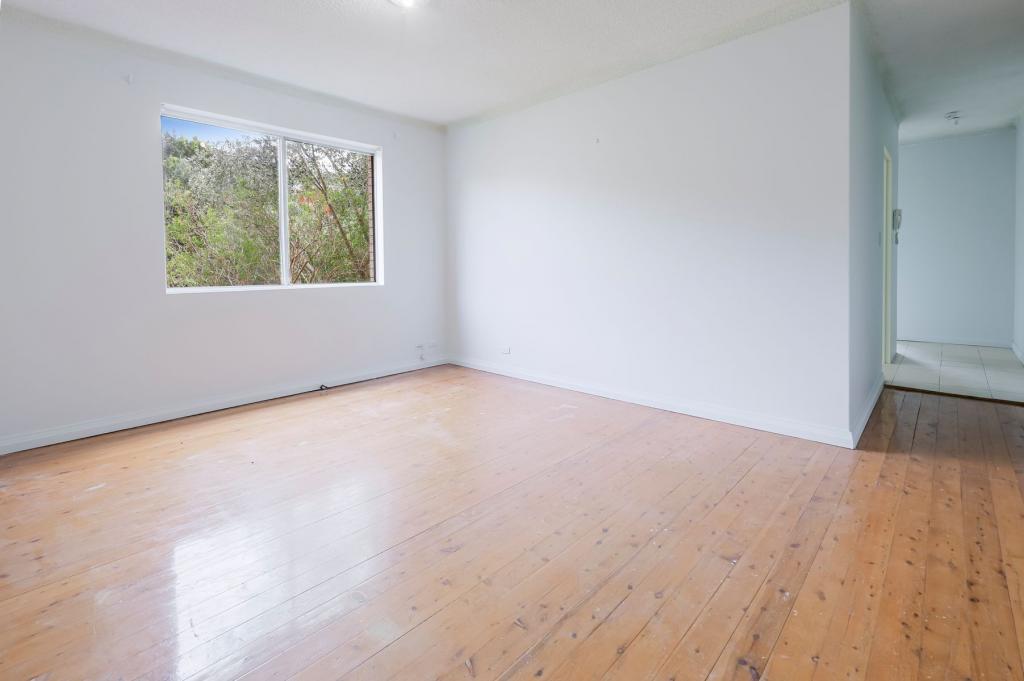 0
0About Belmore 2192
The size of Belmore is approximately 2.8 square kilometres. It has 12 parks covering nearly 4.9% of total area. The population of Belmore in 2011 was 12,574 people. By 2016 the population was 12,746 showing a population growth of 1.4% in the area during that time. The predominant age group in Belmore is 30-39 years. Households in Belmore are primarily couples with children and are likely to be repaying $1800 - $2399 per month on mortgage repayments. In general, people in Belmore work in a professional occupation. In 2011, 56.6% of the homes in Belmore were owner-occupied compared with 52.9% in 2016.
Belmore has 6,537 properties. Over the last 5 years, Houses in Belmore have seen a 46.99% increase in median value, while Units have seen a 13.09% increase. As at 28 February 2025:
- The median value for Houses in Belmore is $1,584,343 while the median value for Units is $623,356.
- Houses have a median rent of $750 while Units have a median rent of $570.
Suburb Insights for Belmore 2192
Market Insights
Belmore Trends for Houses
N/A
N/A
View TrendN/A
N/A
Belmore Trends for Units
N/A
N/A
View TrendN/A
N/A
Neighbourhood Insights
© Copyright 2025 RP Data Pty Ltd trading as CoreLogic Asia Pacific (CoreLogic). All rights reserved.
This product uses cookies and other similar technologies to improve and customise your browsing experience, to tailor content and adverts, and for analytics and metrics regarding visitor usage on this product and other media. We may share cookie and analytics information with third parties for the purposes of advertising. By continuing to use our website, you consent to cookies being used. View our Privacy Policy here.
X