23 Moncur AvenueBelmore NSW 2192
Property Details for 23 Moncur Ave, Belmore
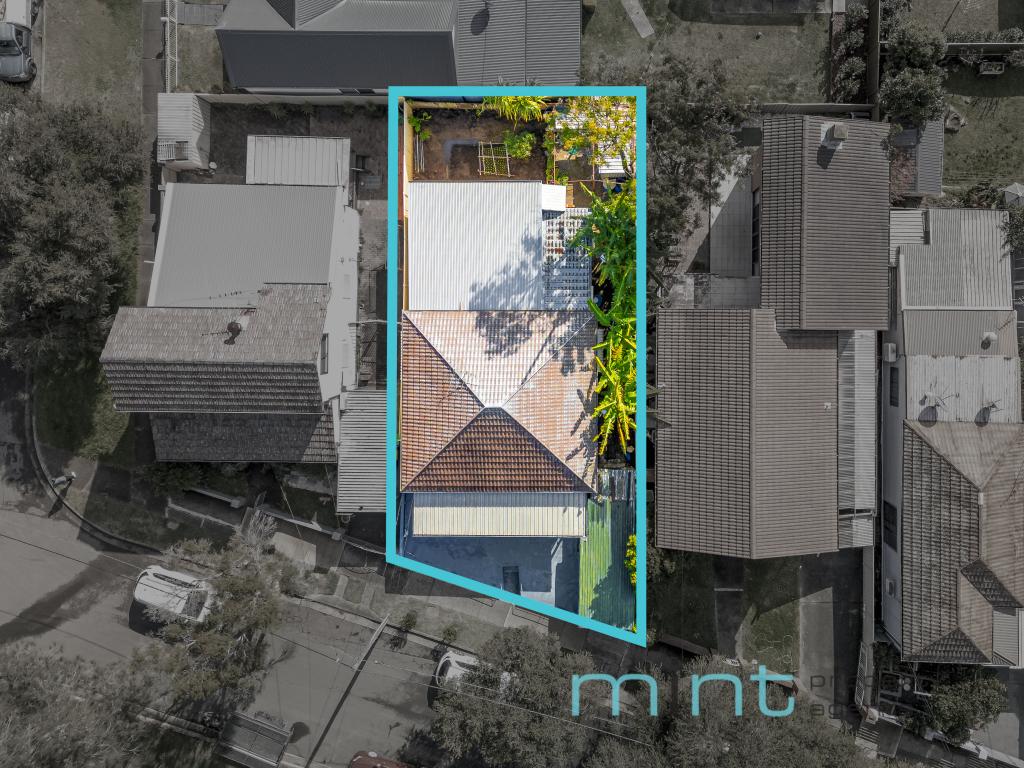
23 Moncur Ave, Belmore is a 3 bedroom, 1 bathroom House. The property has a land size of 574m2 and floor size of 116m2. While the property is not currently for sale or for rent, it was last sold in August 2024. There are other 3 bedroom House sold in Belmore in the last 12 months.
Last Listing description (August 2024)
This charming Californian bungalow opens to an expansive North-facing backyard oasis lined with planter beds and established fruit trees. Sitting on a spacious block with a dedicated workshop, it offers a rare opportunity with renovation potential.
- Freestanding home on a spacious block
- Original fireplace and leadlight windows
- Gas kitchen w/ separate living and dining
- Generous bedrooms, 2 with built-in robes
- Enclosed sunroom/study & ample storage
- Large N-facing backyard w/ est. fruit trees
- Covered alfresco area & outdoor WC/l'dry
- Off-street parking and work/storage space
- Close to surrounding schools & transport
- Council $435 | Water $195 p/q
Property History for 23 Moncur Ave, Belmore, NSW 2192
- 03 Aug 2024Sold for $1,685,000
- 11 Jul 2024Listed for Sale Sold $1,685,000
- 17 Jun 2024Sold
Commute Calculator
Recent sales nearby
See more recent sales nearby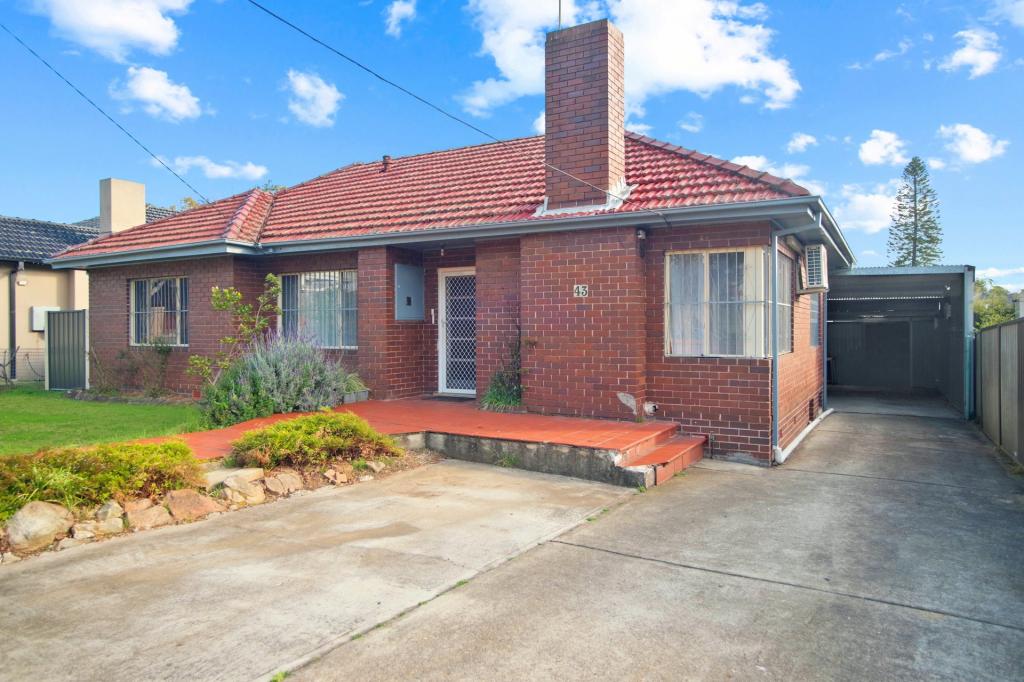 0
0
 0
0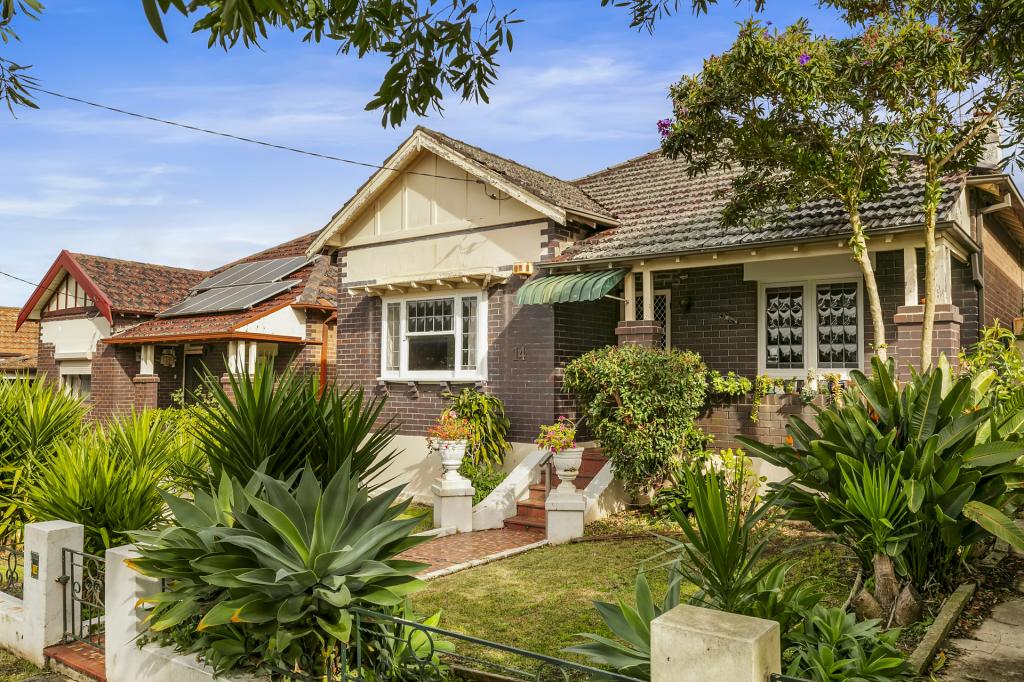 0
0
Similar properties For Sale nearby
See more properties for sale nearby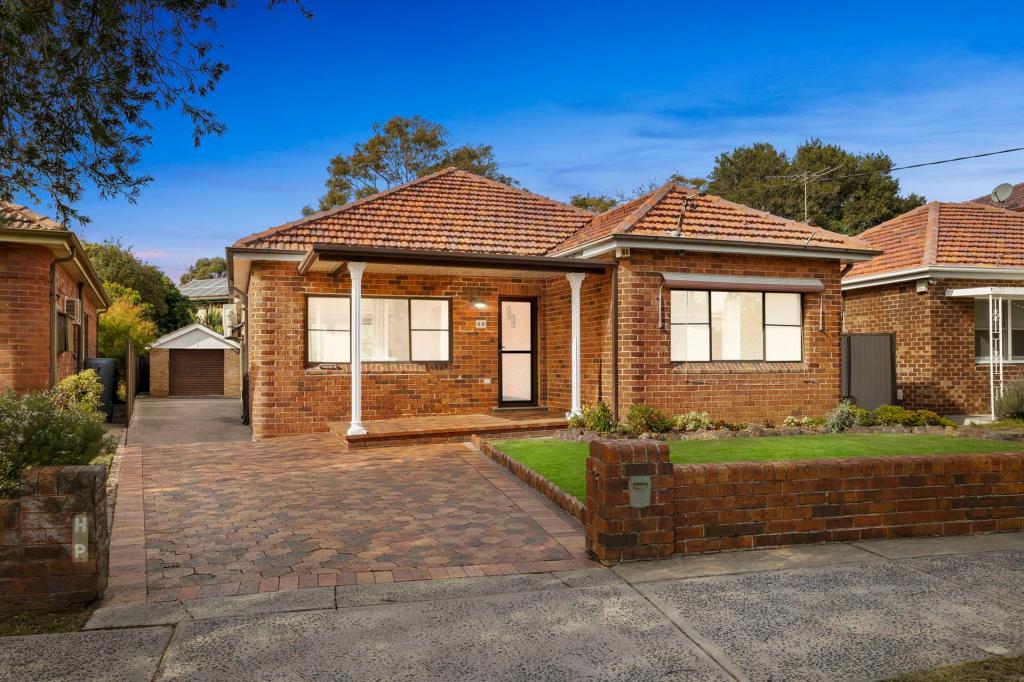 0
0 0
0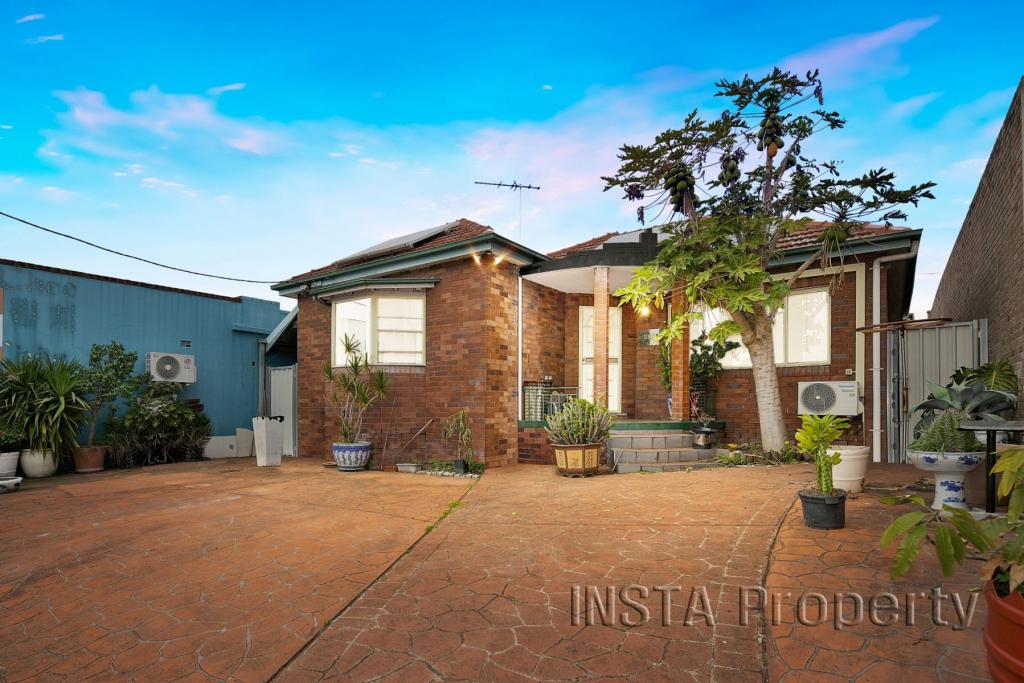 0
0Similar properties For Rent nearby
See more properties for rent nearby 0
0
 0
0 0
0
About Belmore 2192
The size of Belmore is approximately 2.8 square kilometres. It has 12 parks covering nearly 4.9% of total area. The population of Belmore in 2011 was 12,574 people. By 2016 the population was 12,746 showing a population growth of 1.4% in the area during that time. The predominant age group in Belmore is 30-39 years. Households in Belmore are primarily couples with children and are likely to be repaying $1800 - $2399 per month on mortgage repayments. In general, people in Belmore work in a professional occupation. In 2011, 56.6% of the homes in Belmore were owner-occupied compared with 52.9% in 2016.
Belmore has 6,535 properties. Over the last 5 years, Houses in Belmore have seen a 74.89% increase in median value, while Units have seen a 17.95% increase. As at 31 August 2024:
- The median value for Houses in Belmore is $1,634,083 while the median value for Units is $600,381.
- Houses have a median rent of $750 while Units have a median rent of $550.
Suburb Insights for Belmore 2192
Market Insights
Belmore Trends for Houses
N/A
N/A
View TrendN/A
N/A
Belmore Trends for Units
N/A
N/A
View TrendN/A
N/A
Neighbourhood Insights
© Copyright 2024 RP Data Pty Ltd trading as CoreLogic Asia Pacific (CoreLogic). All rights reserved.
This product uses cookies and other similar technologies to improve and customise your browsing experience, to tailor content and adverts, and for analytics and metrics regarding visitor usage on this product and other media. We may share cookie and analytics information with third parties for the purposes of advertising. By continuing to use our website, you consent to cookies being used. View our Privacy Policy here.
X