129 Keenans RoadBatlow NSW 2730

Thinking about insurance?
Get estimated rebuild costs for this property with Sum SureProperty Details for 129 Keenans Rd, Batlow
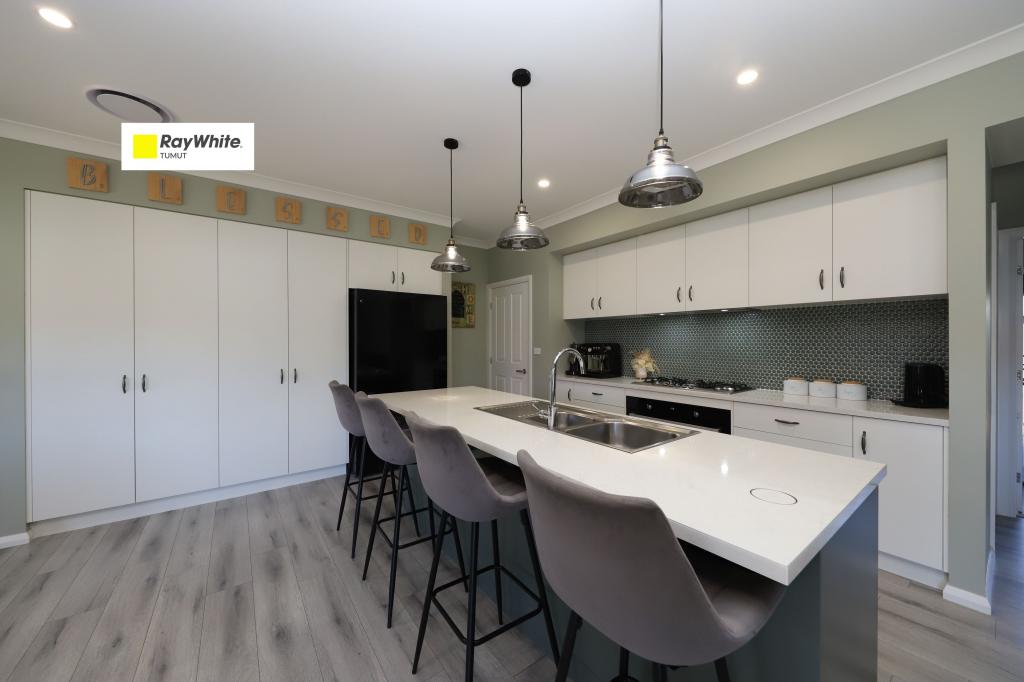
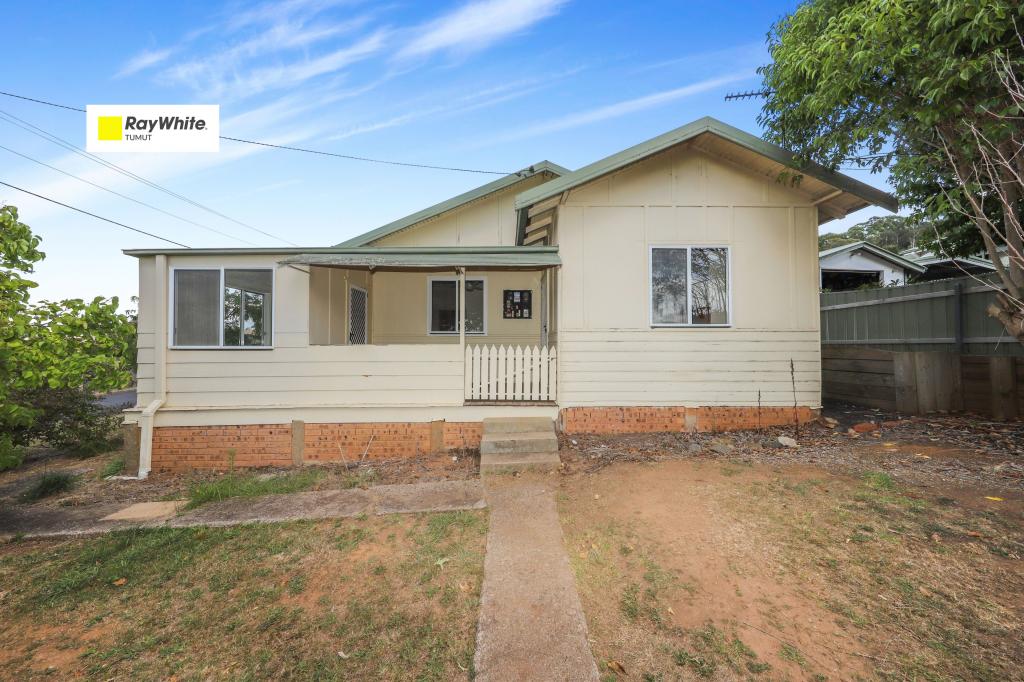
129 Keenans Rd, Batlow is a 3 bedroom, 2 bathroom House with 4 parking spaces and was built in 1980. The property has a land size of 13992m2 and floor size of 166m2. While the property is not currently for sale or for rent, it was last sold in February 2020.
Last Listing description (August 2020)
:: Excellent location :: Well watered :: Established gardens "Carrington" 129 Keenans Road, located 2klm from Batlow township. This delightful 30 hectare property is well watered with 3 dams and a small creek. An extremely unique opportunity to purchase land in the scenic Batlow district. This property has got it all, cattle yards, 2 bay machinery shed, 4 bay hay shed, outside bathroom facilities and divided into 6 paddocks. A 3 bedroom hom situated in well established landscaped gardens tops it off. This home has garage and carport facilities along with disheasher, 2 reverse cycle air-conditions, wood heater and 2 gas bayonets available if required. The master has built-in robes. Inspection of the idylic property is a must.
Property History for 129 Keenans Rd, Batlow, NSW 2730
- 24 Feb 2020Sold for $600,000
- 12 Mar 2019Listed for Sale $640,000
- 19 Oct 2018Listed for Sale $640,000
Recent sales nearby
See more recent sales nearby
Similar properties For Sale nearby
See more properties for sale nearby

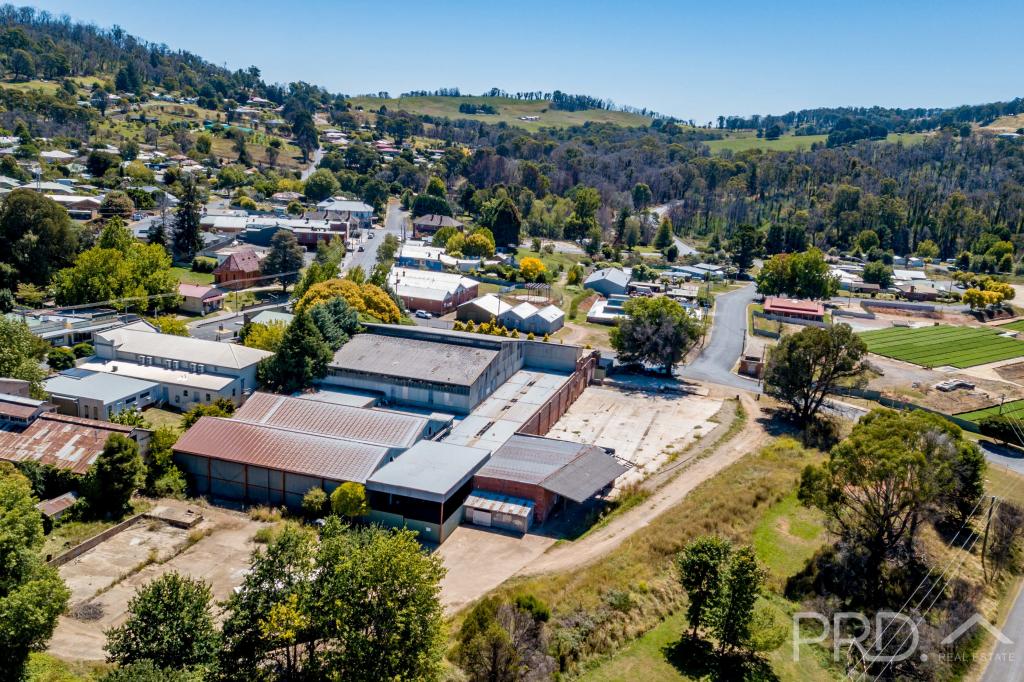
About Batlow 2730
The size of Batlow is approximately 167 square kilometres. It has 2 parks covering nearly 47.5% of total area. The population of Batlow in 2011 was 1,421 people. By 2016 the population was 1,293 showing a population decline of 9.0% in the area during that time. The predominant age group in Batlow is 60-69 years. Households in Batlow are primarily childless couples and are likely to be repaying $1000 - $1399 per month on mortgage repayments. In general, people in Batlow work in a labourer occupation. In 2011, 70.3% of the homes in Batlow were owner-occupied compared with 72.5% in 2016.
Batlow has 897 properties. Over the last 5 years, Houses in Batlow have seen a 113.10% increase in median value. As at 28 February 2025:
- The median value for Houses in Batlow is $364,292 while the median value for Units is $349,035.
- Houses have a median rent of $353.
What's around 129 Keenans Rd, Batlow
129 Keenans Rd, Batlow is in the school catchment zone for Batlow Technology School.


Suburb Insights for Batlow 2730
Market Insights
Batlow Trends for Houses
$364k
8.74%
View Trend$352.5/W
5.88%
Batlow Trends for Units
$349k
N/A
View TrendN/A
N/A
Neighbourhood Insights
Age
Population 1,293
0-9
9%
10-19
10%
20-29
11%
30-39
9%
40-49
11%
50-59
15%
60-69
19%
70-79
10%
80-89
6%
90-99
1%
Household Structure
Occupancy
© Copyright 2025 RP Data Pty Ltd trading as CoreLogic Asia Pacific (CoreLogic). All rights reserved.
This product uses cookies and other similar technologies to improve and customise your browsing experience, to tailor content and adverts, and for analytics and metrics regarding visitor usage on this product and other media. We may share cookie and analytics information with third parties for the purposes of advertising. By continuing to use our website, you consent to cookies being used. View our Privacy Policy here.
X