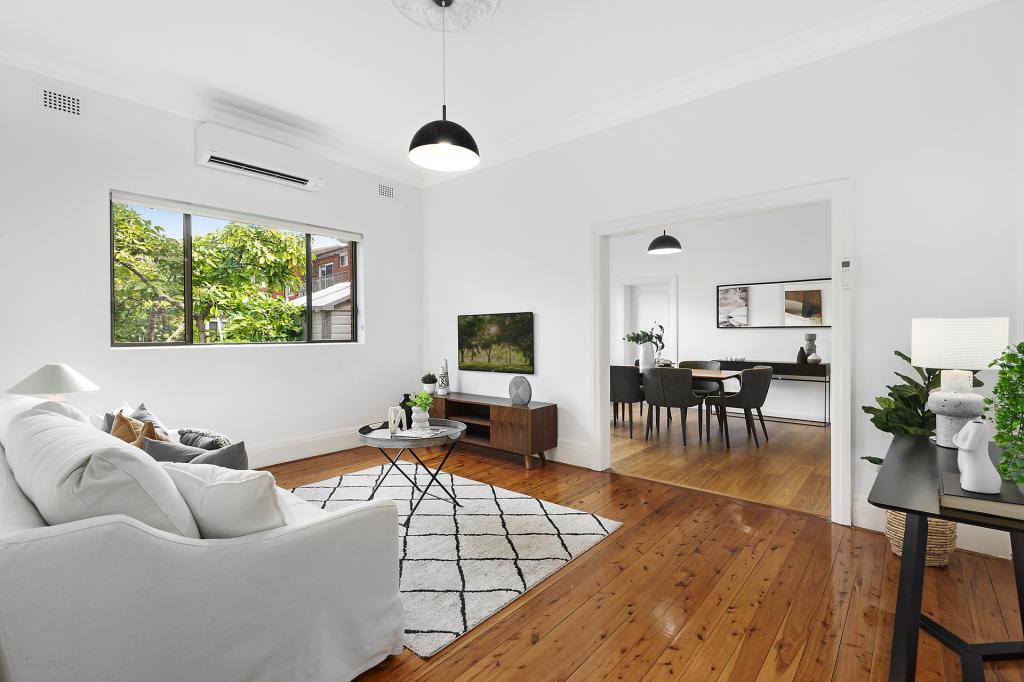
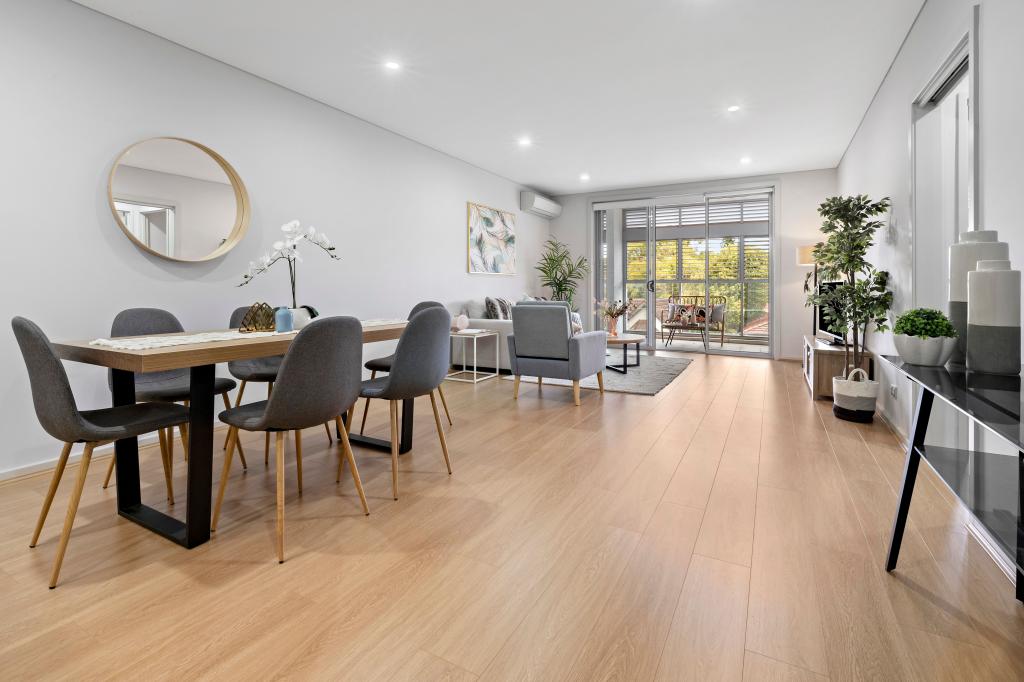
33 King StreetAshbury NSW 2193

Thinking about insurance?
Get estimated rebuild costs for this property with Sum SureProperty Details for 33 King St, Ashbury
33 King St, Ashbury is a 4 bedroom, 2 bathroom House with 1 parking spaces. The property has a land size of 525m2 and floor size of 192m2. While the property is not currently for sale or for rent, it was last sold in December 1999.
Property History for 33 King St, Ashbury, NSW 2193
- 19 Sep 2024Sold
- 20 May 2022Sold
- 21 Dec 1999Sold for $310,000
Recent sales nearby
See more recent sales nearby
Similar properties For Sale nearby
See more properties for sale nearby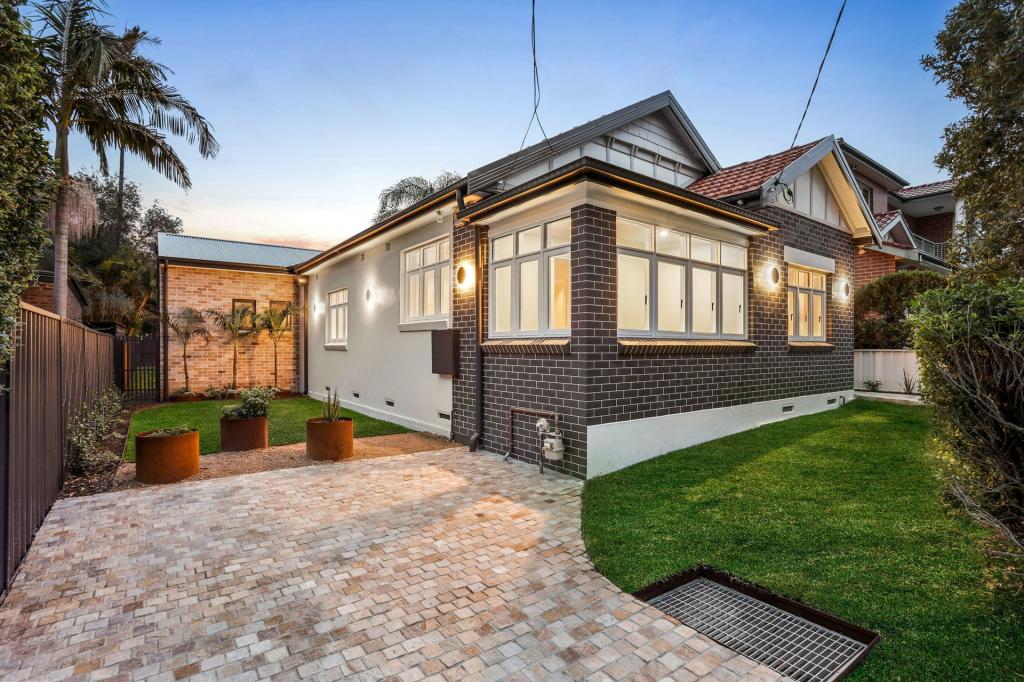
Similar properties For Rent nearby
See more properties for rent nearby
About Ashbury 2193
The size of Ashbury is approximately 1 square kilometres. It has 7 parks covering nearly 12.2% of total area. The population of Ashbury in 2011 was 3,134 people. By 2016 the population was 3,327 showing a population growth of 6.2% in the area during that time. The predominant age group in Ashbury is 40-49 years. Households in Ashbury are primarily couples with children and are likely to be repaying over $4000 per month on mortgage repayments. In general, people in Ashbury work in a professional occupation. In 2011, 84.9% of the homes in Ashbury were owner-occupied compared with 86.3% in 2016.
Ashbury has 1,383 properties. Over the last 5 years, Houses in Ashbury have seen a 40.28% increase in median value, while Units have seen a -9.50% decrease. As at 31 March 2025:
- The median value for Houses in Ashbury is $2,265,474 while the median value for Units is $773,613.
- Houses have a median rent of $925.
What's around 33 King St, Ashbury
33 King St, Ashbury is in the school catchment zone for Ashbury Public School and Canterbury Boys High School.


Suburb Insights for Ashbury 2193
Market Insights
Ashbury Trends for Houses
$2.27M
2.04%
View Trend$925/W
2.24%
Ashbury Trends for Units
$774k
-11.32%
View TrendN/A
N/A
Neighbourhood Insights
Age
Population 3,327
0-9
13%
10-19
14%
20-29
9%
30-39
10%
40-49
16%
50-59
16%
60-69
11%
70-79
8%
80-89
3%
90-99
1%
Household Structure
Occupancy
© Copyright 2025 RP Data Pty Ltd trading as CoreLogic Asia Pacific (CoreLogic). All rights reserved.
This product uses cookies and other similar technologies to improve and customise your browsing experience, to tailor content and adverts, and for analytics and metrics regarding visitor usage on this product and other media. We may share cookie and analytics information with third parties for the purposes of advertising. By continuing to use our website, you consent to cookies being used. View our Privacy Policy here.
X