8 Orlick StreetAmbarvale NSW 2560
Property Details for 8 Orlick St, Ambarvale
8 Orlick St, Ambarvale is a 3 bedroom, 1 bathroom House with 1 parking spaces and was built in 1980. The property has a land size of 608m2 and floor size of 124m2. While the property is not currently for sale or for rent, it was last sold in December 2022.
Last Listing description (February 2023)
Sitting on a 608 sqm block of land in the heart of Ambarvale, this home offers a perfect start for a first home owner or investor alike. The home is extremely family friendly offering a spacious layout with plenty of natural light plus two living zones and a massive backyard.
Featuring :
- Three good sized bedrooms
- Kitchen offering plenty of bench and cupboard space
- Dishwasher
- Centrally located family bathroom
- Internal laundry
- Down lights
- Split system air conditioning
- Approx 608 sqm block
- Granny flat potential (S.T.C.A)
- Double car port
All this is located within close proximity to local schools, shops and public transport.
Call today to arrange your inspection !
Disclaimer:
All information contained herein is gathered from sources we believe to be reliable, we cannot guarantee accuracy. Any interested persons should rely on their own enquiries.
Property History for 8 Orlick St, Ambarvale, NSW 2560
- 22 Dec 2022Sold for $722,000
- 18 Nov 2022Listed for Sale $720,000 - $770,000
- 21 Jan 2011Sold for $325,000
Commute Calculator
Recent sales nearby
See more recent sales nearby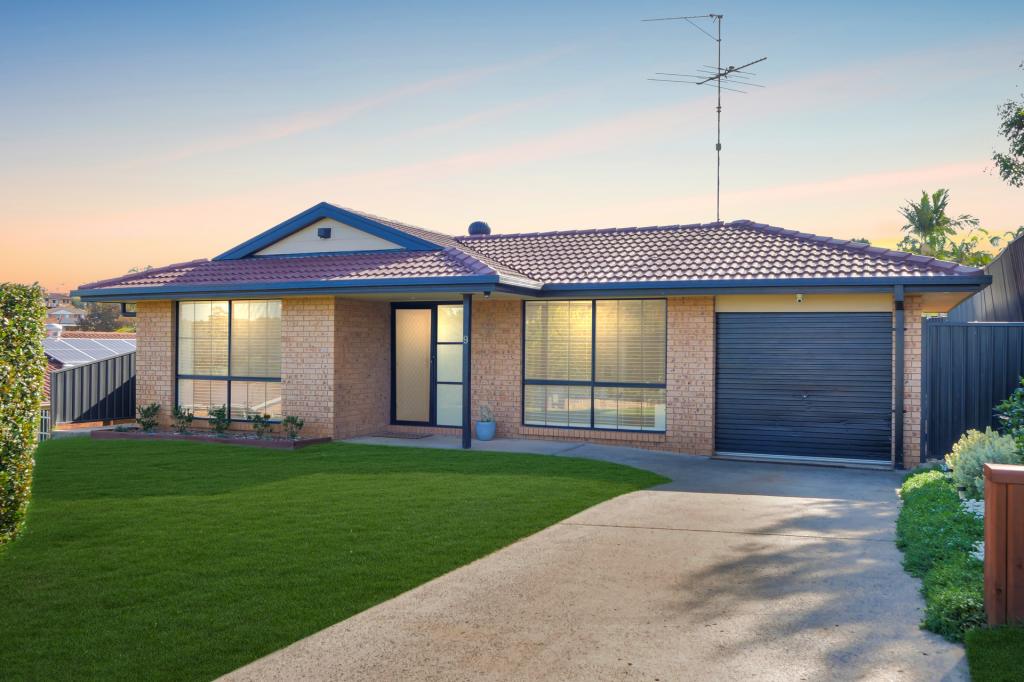 0
0 0
0Similar properties For Sale nearby
See more properties for sale nearby 0
0 0
0 0
0Similar properties For Rent nearby
See more properties for rent nearby 0
0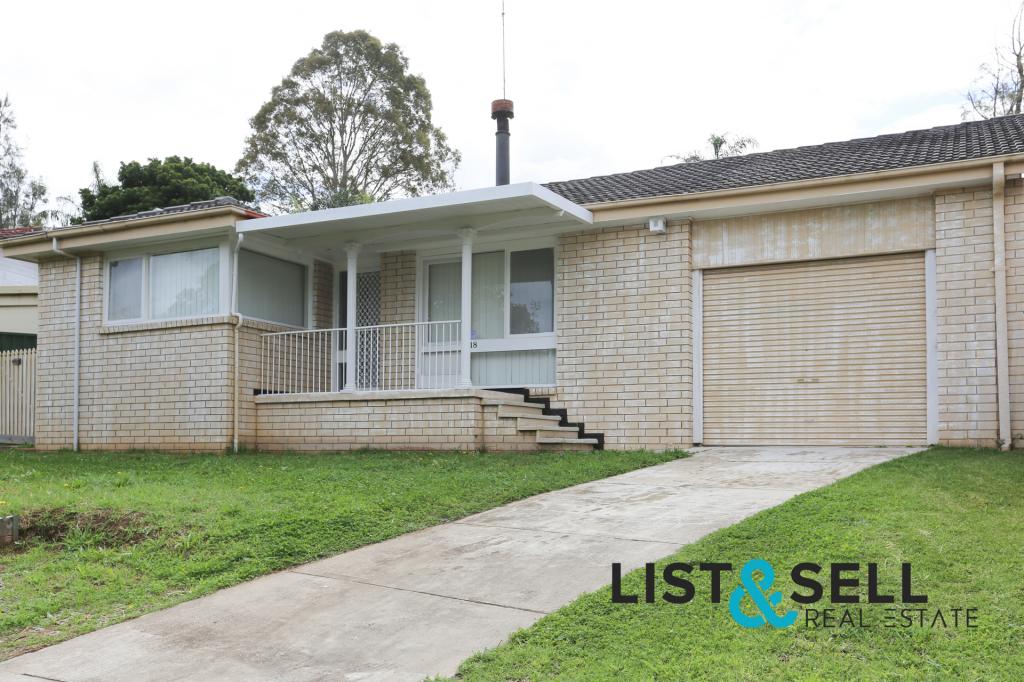 0
0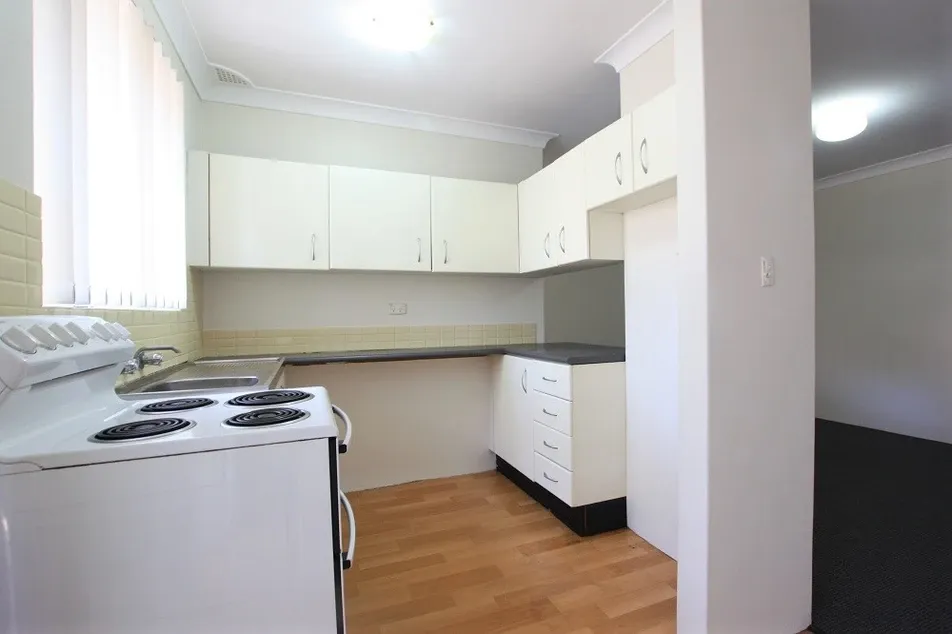 0
0About Ambarvale 2560
The size of Ambarvale is approximately 2.8 square kilometres. It has 19 parks covering nearly 20.8% of total area. The population of Ambarvale in 2011 was 7,213 people. By 2016 the population was 7,395 showing a population growth of 2.5% in the area during that time. The predominant age group in Ambarvale is 0-9 years. Households in Ambarvale are primarily couples with children and are likely to be repaying $1400 - $1799 per month on mortgage repayments. In general, people in Ambarvale work in a clerical occupation. In 2011, 58.5% of the homes in Ambarvale were owner-occupied compared with 54% in 2016.
Ambarvale has 2,518 properties. Over the last 5 years, Houses in Ambarvale have seen a 64.65% increase in median value, while Units have seen a 45.10% increase. As at 31 October 2024:
- The median value for Houses in Ambarvale is $890,478 while the median value for Units is $508,109.
- Houses have a median rent of $580 while Units have a median rent of $450.
Suburb Insights for Ambarvale 2560
Market Insights
Ambarvale Trends for Houses
N/A
N/A
View TrendN/A
N/A
Ambarvale Trends for Units
N/A
N/A
View TrendN/A
N/A
Neighbourhood Insights
© Copyright 2024 RP Data Pty Ltd trading as CoreLogic Asia Pacific (CoreLogic). All rights reserved.
This product uses cookies and other similar technologies to improve and customise your browsing experience, to tailor content and adverts, and for analytics and metrics regarding visitor usage on this product and other media. We may share cookie and analytics information with third parties for the purposes of advertising. By continuing to use our website, you consent to cookies being used. View our Privacy Policy here.
X