26 Cooley CrescentCasey ACT 2913
Property Details for 26 Cooley Cres, Casey
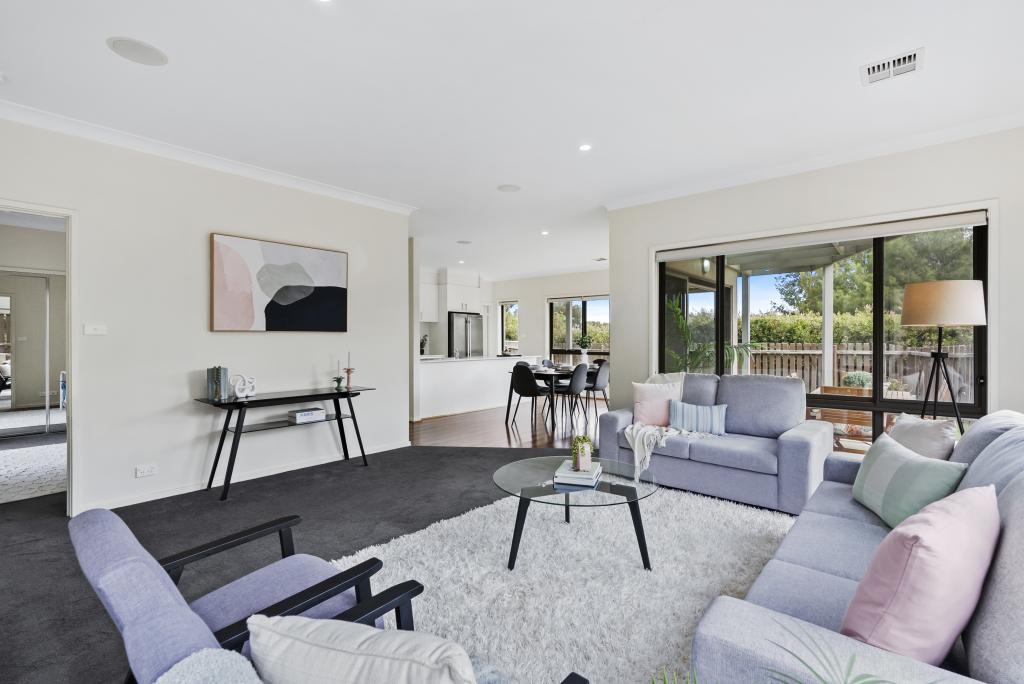
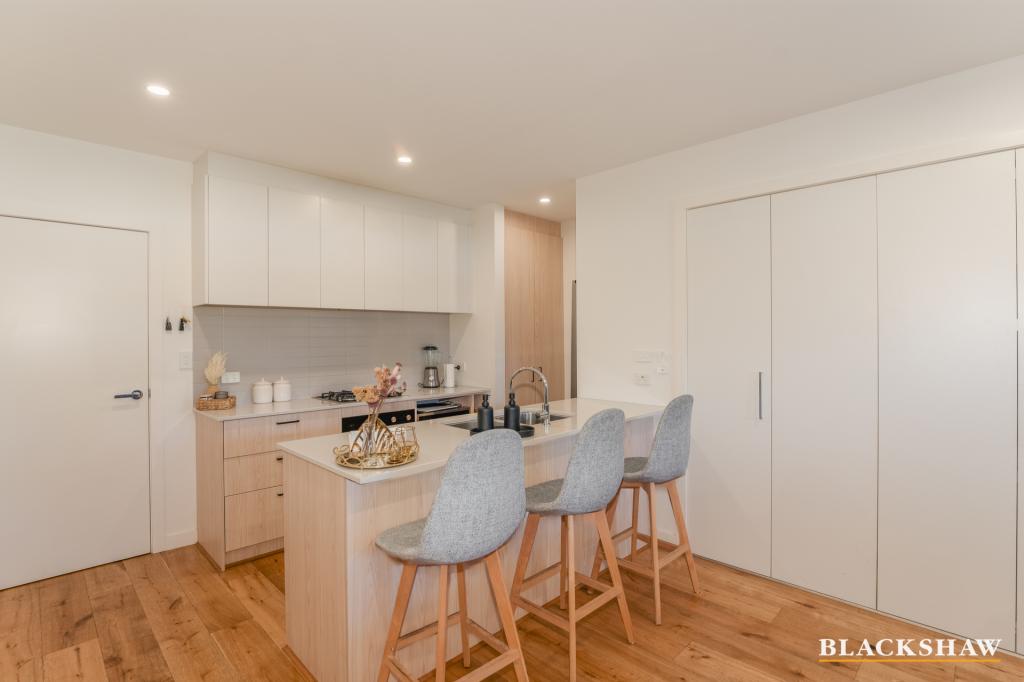
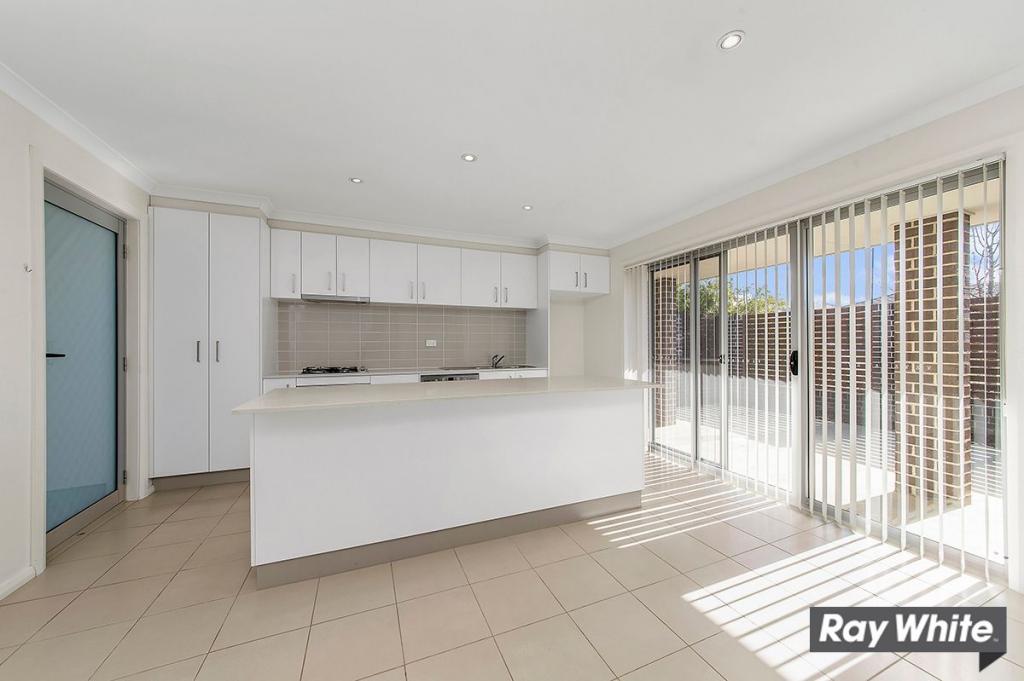
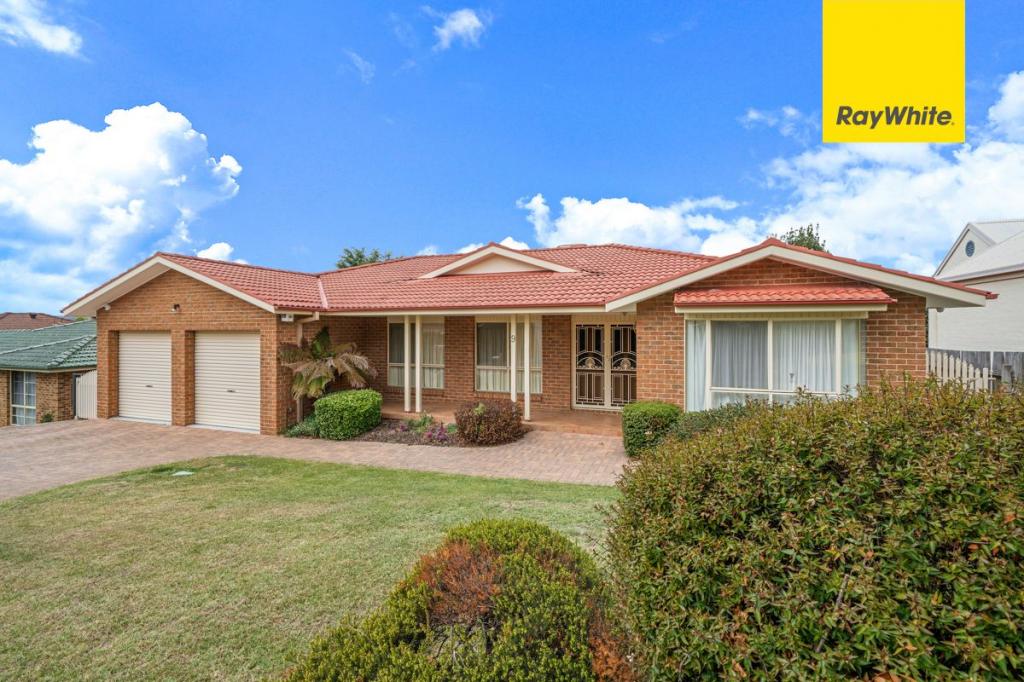
26 Cooley Cres, Casey is a 4 bedroom, 3 bathroom House with 2 parking spaces and was built in 2013. The property has a land size of 628m2 and floor size of 263m2. While the property is not currently for sale or for rent, it was last sold in October 2024. There are 46 other 4 bedroom Houses sold in Casey in the last 12 months.
Property History for 26 Cooley Cres, Casey, ACT 2913
- 23 Oct 2024Sold for $1,285,000
- 09 Sep 2010Sold for $286,000
Recent sales nearby
See more recent sales nearbySimilar properties For Sale nearby
See more properties for sale nearby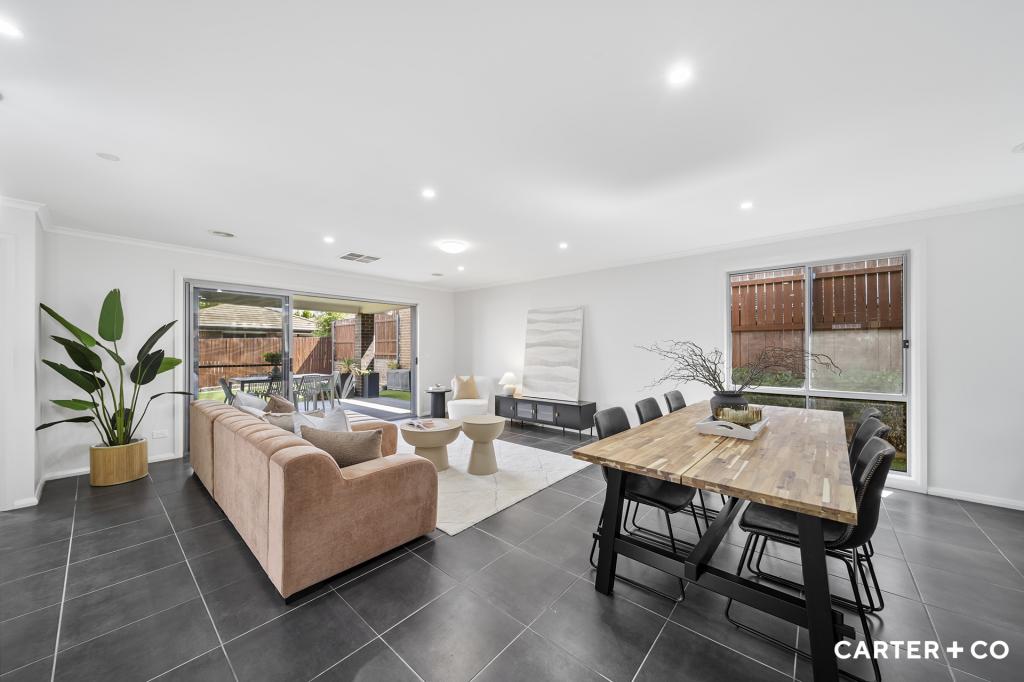

Similar properties For Rent nearby
See more properties for rent nearby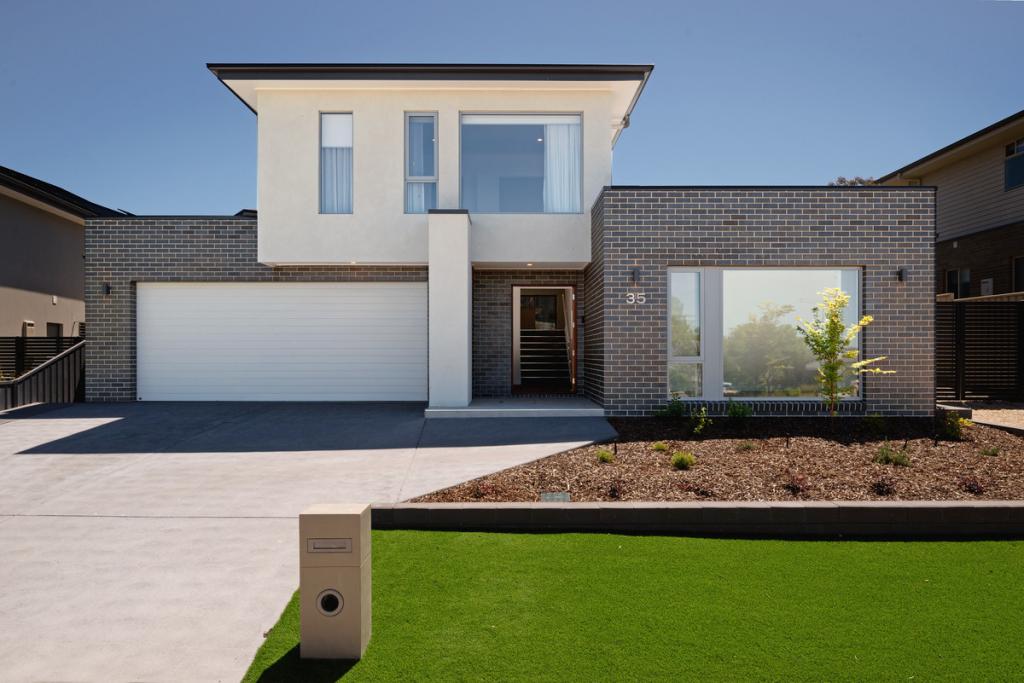
About Casey 2913
The size of Casey is approximately 2.6 square kilometres. It has 4 parks covering nearly 27% of total area. The population of Casey in 2011 was 1,490 people. By 2016 the population was 5,752 showing a population growth of 286.0% in the area during that time. The predominant age group in Casey is 30-39 years. Households in Casey are primarily couples with children and are likely to be repaying $1800 - $2399 per month on mortgage repayments. In general, people in Casey work in a professional occupation. In 2011, 74.5% of the homes in Casey were owner-occupied compared with 72.2% in 2016.
Casey has 2,524 properties. Over the last 5 years, Houses in Casey have seen a 39.50% increase in median value, while Units have seen a 33.51% increase. As at 31 March 2025:
- The median value for Houses in Casey is $979,864 while the median value for Units is $640,023.
- Houses have a median rent of $660 while Units have a median rent of $600.
What's around 26 Cooley Cres, Casey
26 Cooley Cres, Casey is in the school catchment zone for Gold Creek School and Gungahlin College.


Suburb Insights for Casey 2913
Market Insights
Casey Trends for Houses
$980k
1.39%
View Trend$660/W
4.06%
Casey Trends for Units
$640k
-0.08%
View Trend$600/W
5.08%
Neighbourhood Insights
Age
Population 5,752
0-9
20%
10-19
10%
20-29
18%
30-39
28%
40-49
13%
50-59
7%
60-69
4%
70-79
1%
Household Structure
Occupancy
© Copyright 2025 RP Data Pty Ltd trading as CoreLogic Asia Pacific (CoreLogic). All rights reserved.
This product uses cookies and other similar technologies to improve and customise your browsing experience, to tailor content and adverts, and for analytics and metrics regarding visitor usage on this product and other media. We may share cookie and analytics information with third parties for the purposes of advertising. By continuing to use our website, you consent to cookies being used. View our Privacy Policy here.
X