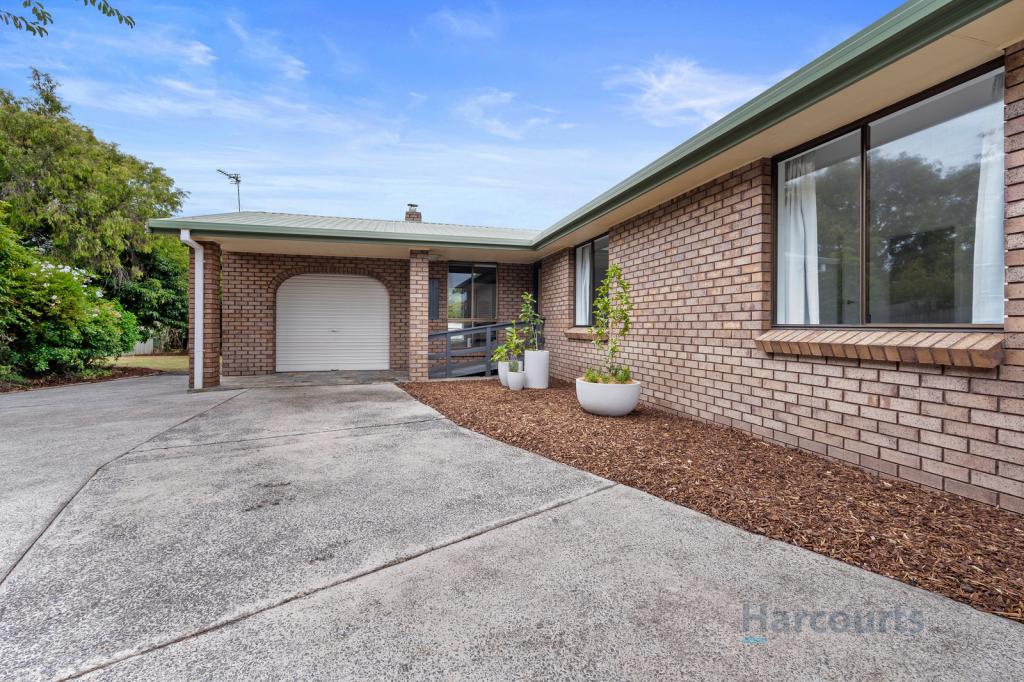
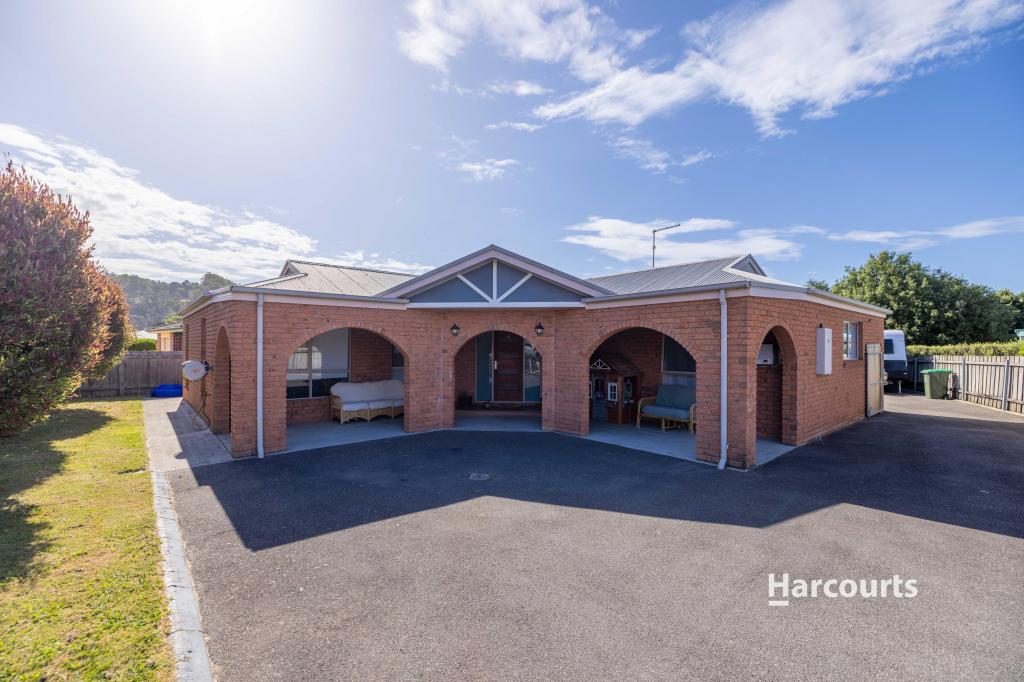
FOR SALE
Offers Over $595,000

11 Oakwood Drive
Ambleside TAS 7310

Bedrooms: 4
Bathrooms: 2
Car spaces: 2
Floor area: 206m2
Land area: 2544m2
Inspection Times
No upcoming inspections scheduled.
Contact agent to arrange an inspection.
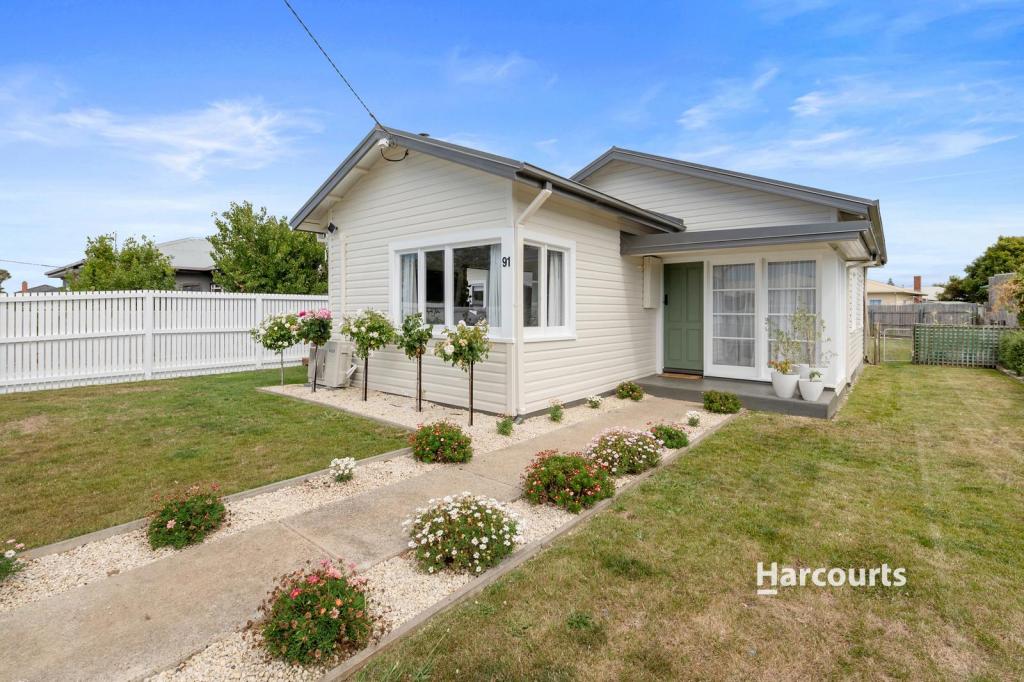
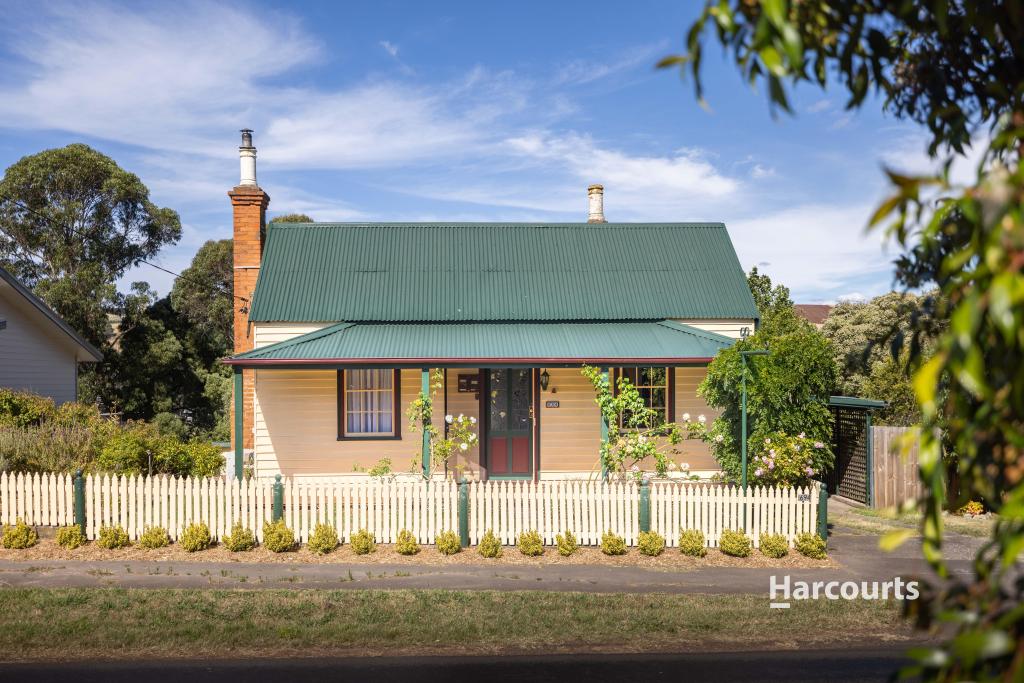
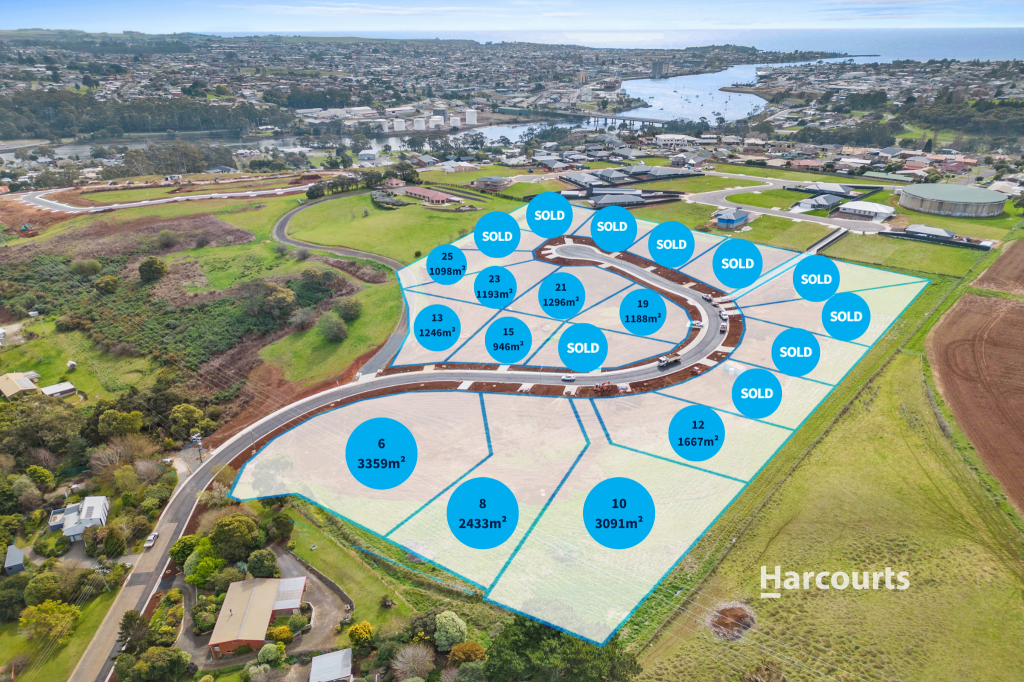
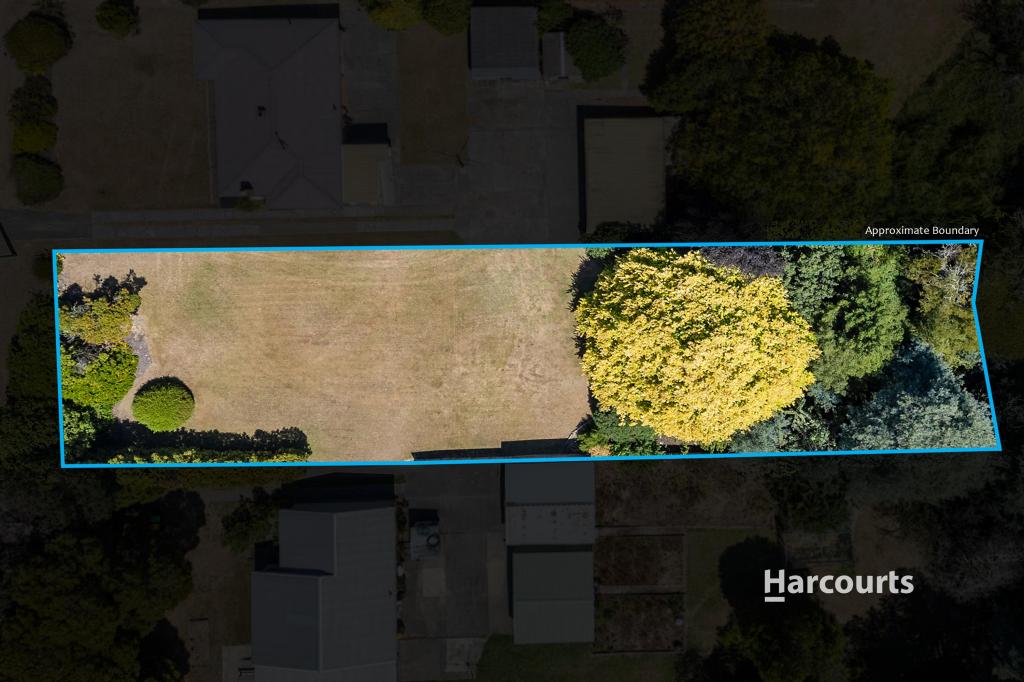
Save

DEVELOP OR DECORATE

Here's a property that is ideally suited to a developer or redecorated/refurbished as a great family home.
With a near flat block of 2,544m² and plenty of space between the house and boundary, an opportunity awaits to sub-divide or build a strata development of units or townhouses (STCA), the latter affording river views.
The comfortably sized 4-bedroom split-level house of around 210m² features new carpets and paint and is ripe for a refurb, making it a great rental or family home. It includes 2 bathrooms-one with a toilet and shower only-offering added convenience for a busy household.
For more information and inspections please contact the agents.
Disclaimer:
While Harcourts Ulverstone & Penguin has taken every care to verify the accuracy of the details in this advertisement, we cannot guarantee its correctness. Prospective buyers need to take such action as is necessary, to satisfy themselves of any pertinent matters.

Property Details for 11 Oakwood Dr, Ambleside

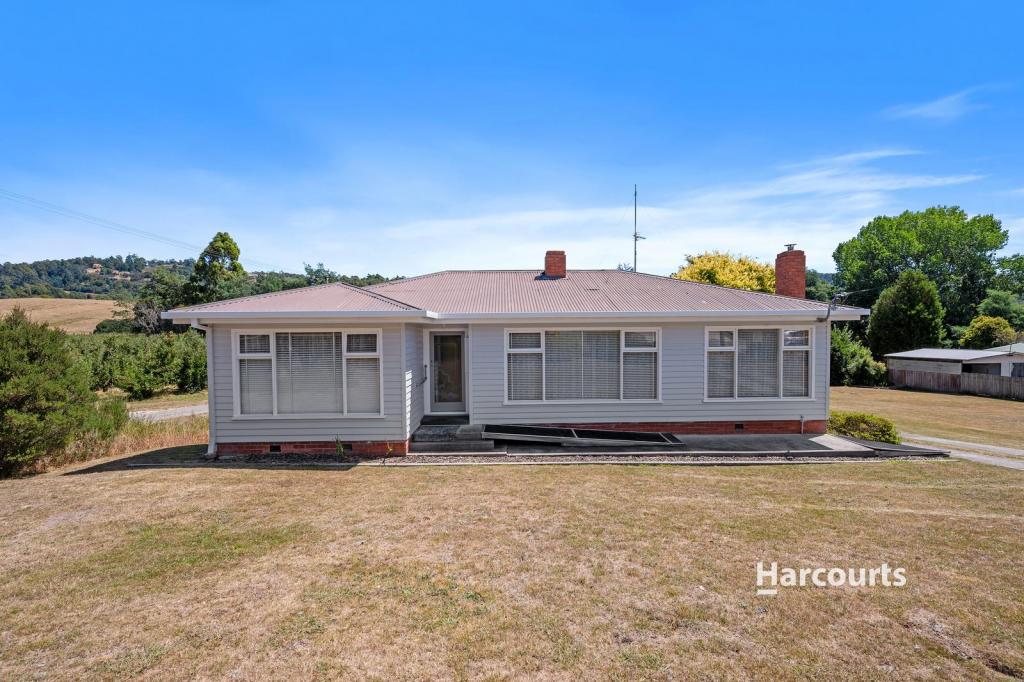
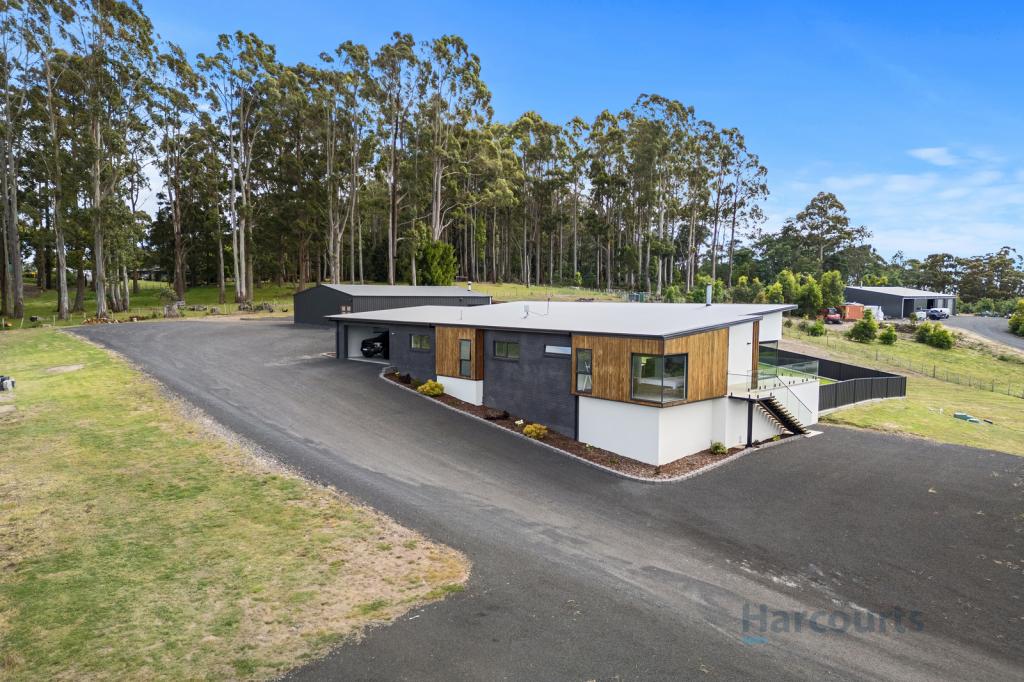
11 Oakwood Dr, Ambleside is a 4 bedroom, 2 bathroom House with 2 parking spaces. The property has a land size of 2544m2 and floor size of 206m2. The place is currently for sale with Harcourts Ulverstone & Penguin.

Building Type
House
Floor Size
206m2
Land Size
2544m2

Commute Calculator

-
-
-
-

About Ambleside 7310

The size of Ambleside is approximately 1.1 square kilometres. It has 4 parks covering nearly 10.6% of total area. The population of Ambleside in 2011 was 715 people. By 2016 the population was 628 showing a population decline of 12.2% in the area during that time. The predominant age group in Ambleside is 60-69 years. Households in Ambleside are primarily childless couples and are likely to be repaying $1000 - $1399 per month on mortgage repayments. In general, people in Ambleside work in a professional occupation. In 2011, 84.5% of the homes in Ambleside were owner-occupied compared with 78.9% in 2016.

Ambleside has 395 properties. Over the last 5 years, Houses in Ambleside have seen a 60.60% increase in median value, while Units have seen a 66.96% increase. As at 31 January 2025:

  • The median value for Houses in Ambleside is $511,251 while the median value for Units is $447,986.
  • Houses have a median rent of $440.
There are currently 10 properties listed for sale, and no properties listed for rent in Ambleside on OnTheHouse. According to CoreLogic's data, 21 properties were sold in the past 12 months in Ambleside.

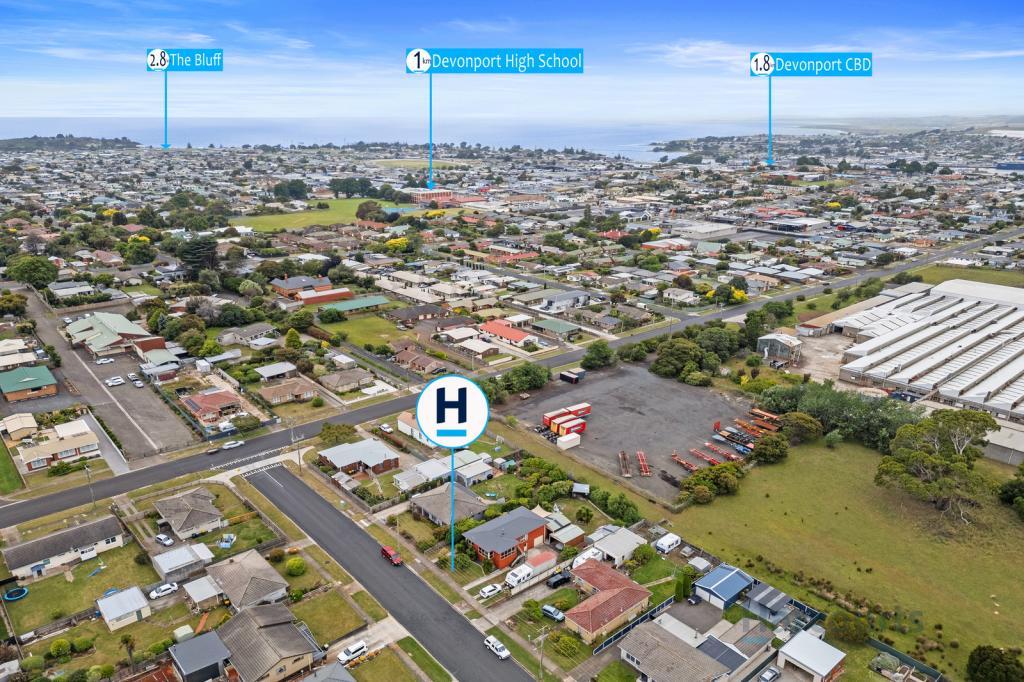
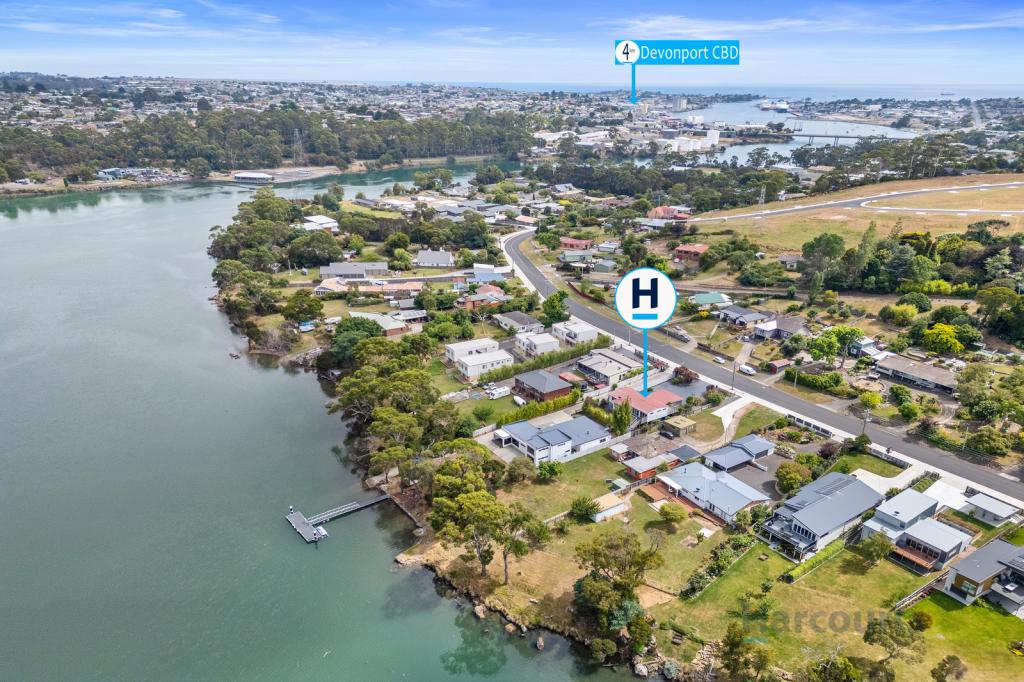
What's around 11 Oakwood Dr, Ambleside

Nearby Schools
Comparable Properties
Miandetta Primary School
2.27km
Miandetta 7310
PrimaryGovernmentP - 6Combined346 Enrolled
Spreyton Primary School
2.6km
Spreyton 7310
PrimaryGovernmentP - 6Combined470 Enrolled
Reece High School
2.7km
Devonport 7310
SecondaryGovernment7 - 11Combined428 Enrolled
East Devonport Primary School
3.01km
East Devonport 7310
PrimaryGovernmentP - 6Combined243 Enrolled
Devonport Primary School
3.08km
Devonport 7310
PrimaryGovernmentP - 6Combined321 Enrolled
Our Lady of Lourdes Catholic School
3.2km
Devonport 7310
PrimaryNon-GovernmentP - 6Combined407 Enrolled
Indie School - Devonport
3.39km
Address not found
SecondaryNon-GovernmentCombined Enrolled
Devonport High School
3.71km
Devonport 7310
SecondaryGovernment7 - 11Combined508 Enrolled
Hillcrest Primary School
4.01km
Devonport 7310
PrimaryGovernmentP - 6Combined224 Enrolled
Nixon Street Primary School
4.72km
Devonport 7310
PrimaryGovernmentP - 6Combined514 Enrolled

Suburb Insights for Ambleside 7310

Market Insights
Ambleside Trends for Houses
Median Value

$511k

3.68%
View Trend
Median Growth

3.00%

View Trend
Median Rent

$440/W

1.12%
View Trend
Rental Yield

4.83%

2.99%
View Trend
Median Value: The middle value of all properties across the geography based on the Automated Valuation Model.


Median Value over 1 year (02/24 - 01/25)
Ambleside Trends for Units
Median Value

$448k

16.30%
View Trend
Median Growth

16.75%

View Trend
Median Rent

N/A

-
View Trend
Rental Yield

5.17%

6.34%
View Trend
Median Value: The middle value of all properties across the geography based on the Automated Valuation Model.


Median Value over 1 year (02/24 - 01/25)
Neighbourhood Insights
Age

Population 628

0-9


10%

10-19


10%

20-29


10%

30-39


10%

40-49


9%

50-59


16%

60-69


18%

70-79


8%

80-89


3%

90-99


1%

Household Structure
Occupancy
Contact agent
Colin Tunn
Show contact details
Jodi Tunn
Show contact details
Harcourts Ulverstone & Penguin
Preferred contact:
Disclaimer
Whilst all reasonable effort is made to ensure the information in this publication is current, CoreLogic does not warrant the accuracy or completeness of the data and information contained in this publication and to the full extent not prohibited by law excludes all for any loss or damage arising in connection with the data and information contained in this publication.
Tasmania data
This product incorporates data that is copyright owned by the Crown in Right of Tasmania. The data has been used in the product with the permission of the Crown in Right of Tasmania. The Crown in Right of Tasmania and its employees and agents:

(a) give no warranty regarding the data's accuracy, completeness, currency or suitability for any particular purpose; and
(b) do not accept liability howsoever arising, including but not limited to negligence for any loss resulting from the use of or reliance upon the data.

Base data from the LIST © State of Tasmania http://www.thelist.tas.gov.au.
Valuations and Estimates
This estimate is provided by CoreLogic, and is based on statistical market data such as recent local sales, property size, number of bedrooms and many more factors. It comes from public data, which may be incomplete or inaccurate, and should not be used in lieu of a professional appraisal under any circumstances, including for lending purposes or in home loan applications.
School data and Content
Product Data licenced by CoreLogic under a Creative Commons Attribution licence. For details regarding licence, data source, copyright and disclaimers, see https://www.corelogic.com.au/legals/third-party-restrictions
ABS data
This publication contains data and statistics provided by the Australian Bureau of Statistics, available at http://www.abs.gov.au/ and reproduced under Creative Commons Attribution 2.5 http://creativecommons.org/licenses/by/2.5/au/legalcode
Liveability information
The Liveability Score is a rating (out of 10) provided by Propella.ai Pty Ltd as a guide about how "well-connected" properties are in certain local areas. The Liveability Score is based on statistical data about a local area in which a property is located including the distance to and number of available facilities and services (including schools, parklands, health services, shopping and public transport) (Liveability Data). The Liveability Data and Liveability Score has not been verified or confirmed by CoreLogic, is not available for all properties, and is of a general nature and should not be construed as specific advice or relied upon in lieu of appropriate professional advice. Given the relative nature of the Liveability Score, propella.ai anticipate that scores for individual properties will change over time.